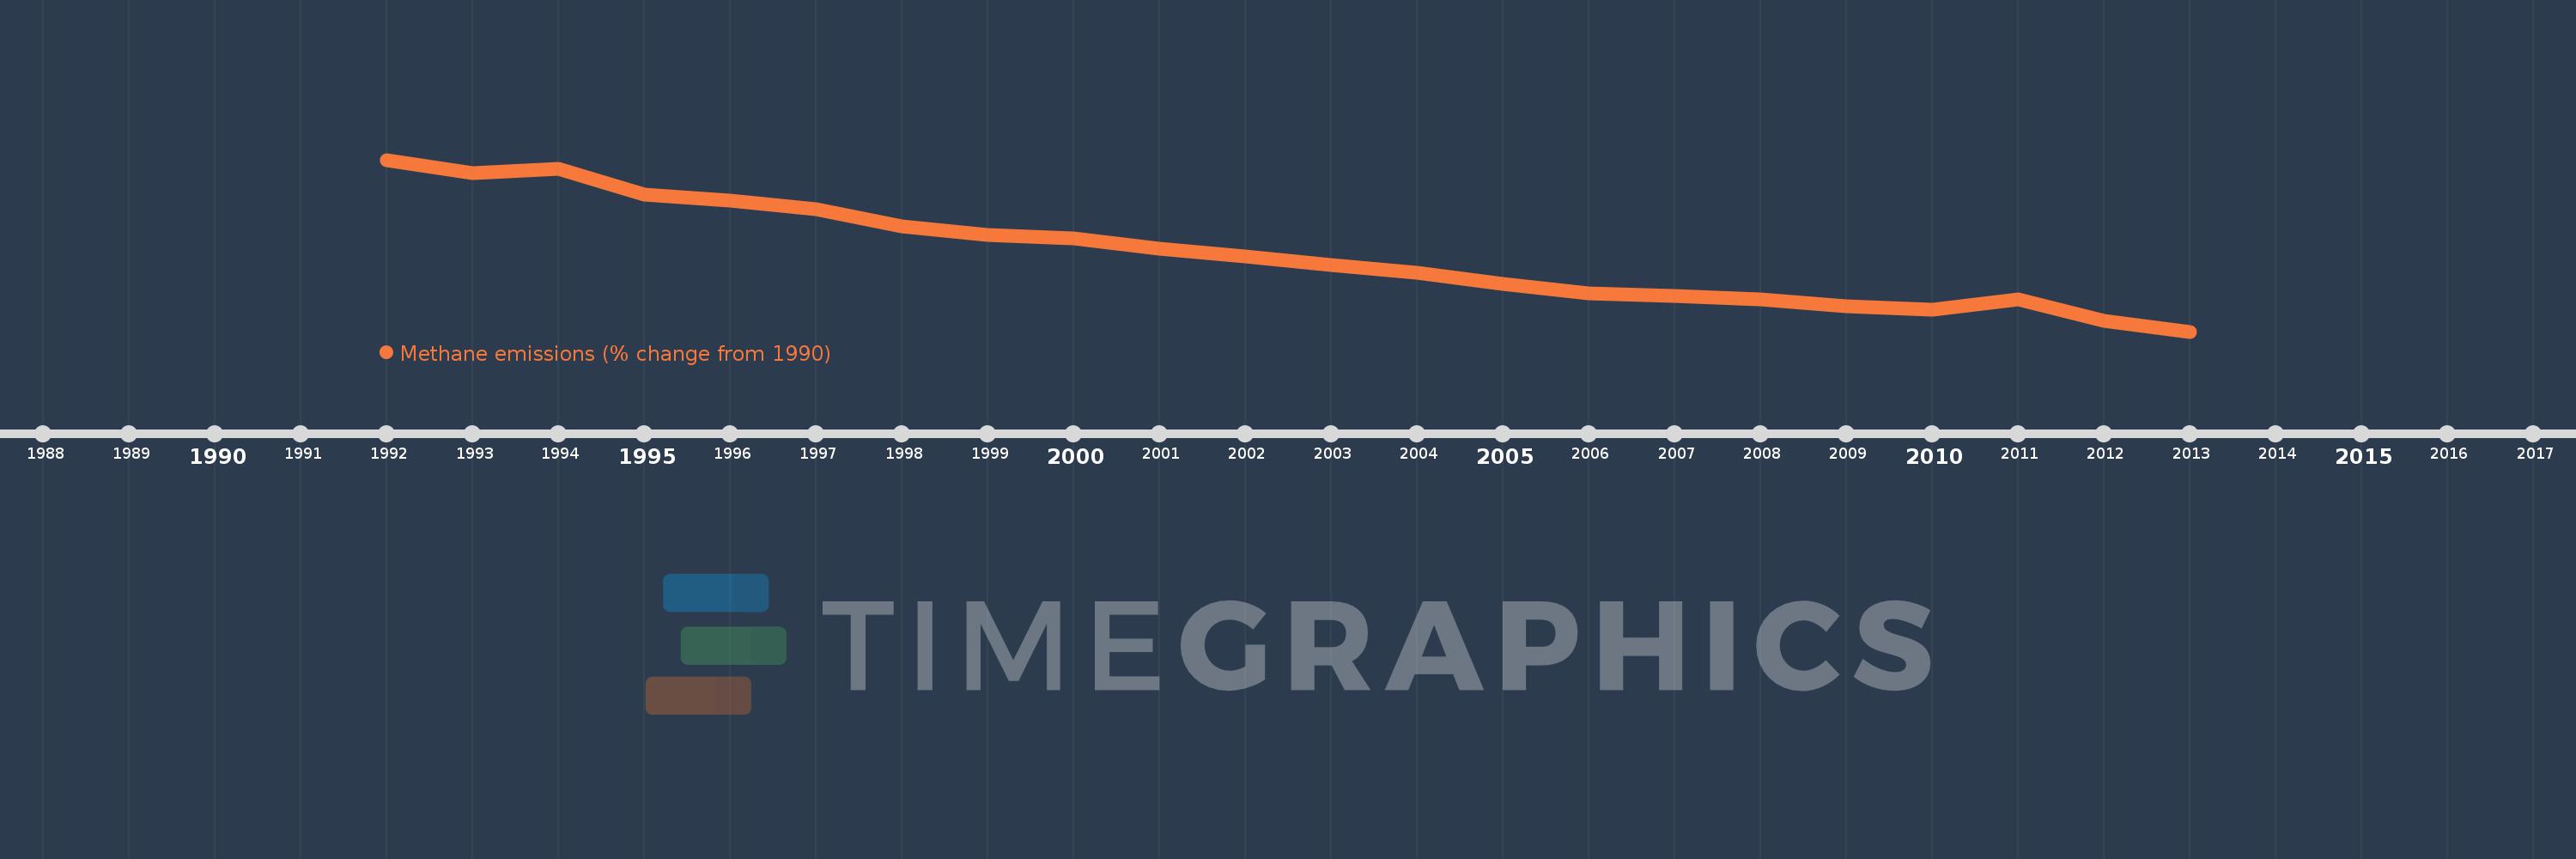
This timeline shows a graph from 1992 to 2013 of Austria. No data until 1991. Number of actual observations by date: 22.
Source name:
World Development Indicators
Source organization:
World Bank staff estimates from original source: European Commission, Joint Research Centre (JRC)/Netherlands Environmental Assessment Agency (PBL). Emission Database for Global Atmospheric Research (EDGAR): http://edgar.jrc.ec.europa.eu/.
Categories, topics:
Climate Change, Environment
Last updated:
apr 23, 2017
Indicators value changes by year
Meaning:
-11.017
Minimum:
-20.166
jan 1, 2013
Maximum:
0.105
jan 1, 1992
At the date of observation
Value
Absolute change
Change from the previous value
jan 1, 1992
0.105
+0.105
0.0%
jan 1, 1993
-1.443
-1.548
-1.48K%
jan 1, 1994
-0.929
+0.514
-35.64%
jan 1, 1995
-4.009
-3.08
331.67%
jan 1, 1996
-4.672
-0.662
16.52%
jan 1, 1997
-5.736
-1.064
22.78%
jan 1, 1998
-7.794
-2.059
35.89%
jan 1, 1999
-8.72
-0.925
11.87%
jan 1, 2000
-9.201
-0.481
5.51%
jan 1, 2001
-10.414
-1.214
13.19%
jan 1, 2002
-11.337
-0.922
8.85%
jan 1, 2003
-12.335
-0.998
8.8%
jan 1, 2004
-13.213
-0.878
7.12%
jan 1, 2005
-14.54
-1.327
10.04%
jan 1, 2006
-15.682
-1.142
7.85%
jan 1, 2007
-15.924
-0.242
1.54%
jan 1, 2008
-16.404
-0.48
3.01%
jan 1, 2009
-17.193
-0.789
4.81%
jan 1, 2010
-17.572
-0.378
2.2%
jan 1, 2011
-16.33
+1.241
-7.06%
jan 1, 2012
-18.861
-2.53
15.5%
jan 1, 2013
-20.166
-1.305
6.92%
Ranking of countries by current statistics by years