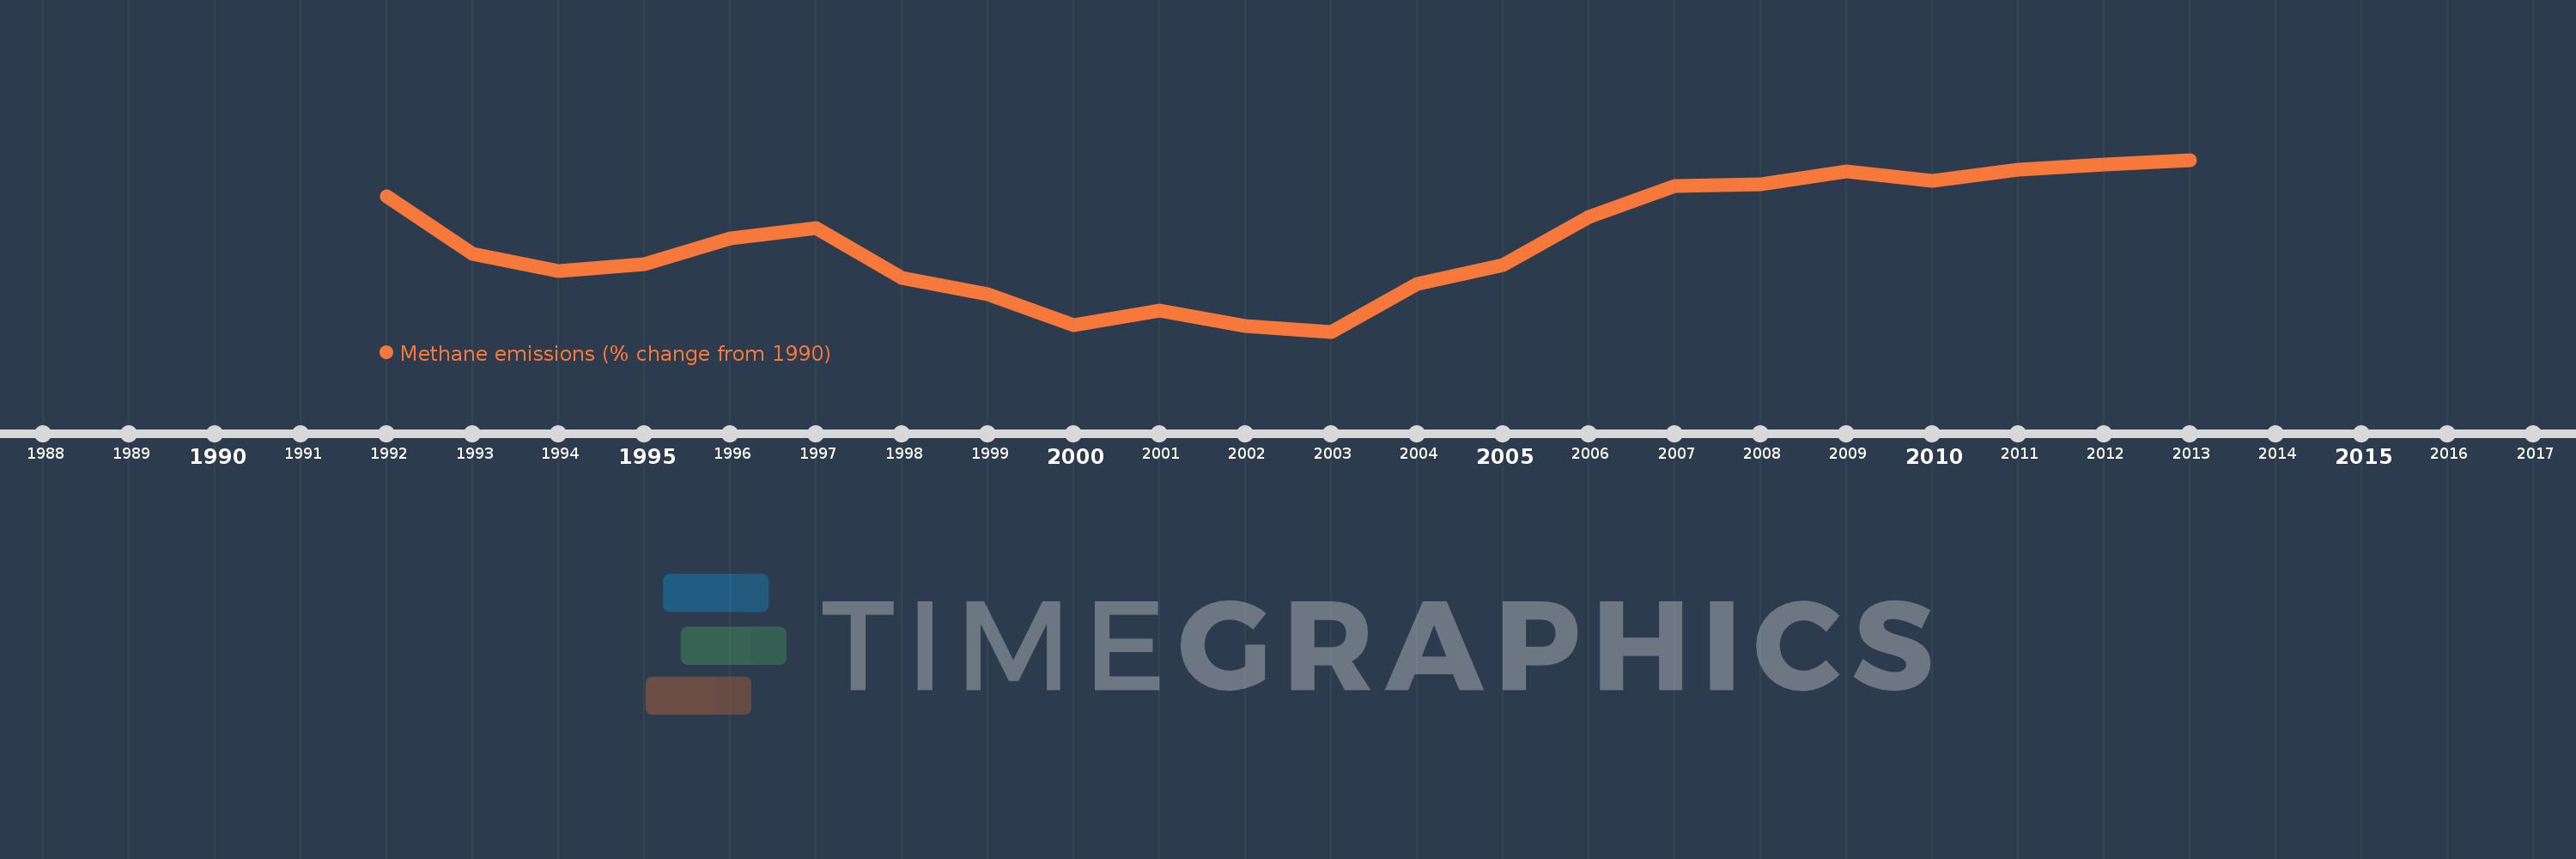
This timeline shows a graph from 1992 to 2013 of Libya. No data until 1991. Number of actual observations by date: 22.
Source name:
World Development Indicators
Source organization:
World Bank staff estimates from original source: European Commission, Joint Research Centre (JRC)/Netherlands Environmental Assessment Agency (PBL). Emission Database for Global Atmospheric Research (EDGAR): http://edgar.jrc.ec.europa.eu/.
Categories, topics:
Climate Change, Environment
Last updated:
apr 23, 2017
Indicators value changes by year
Meaning:
-6.977
Minimum:
-26.355
jan 1, 2003
Maximum:
10.367
jan 1, 2013
At the date of observation
Value
Absolute change
Change from the previous value
jan 1, 1992
2.539
+2.539
0.0%
jan 1, 1993
-9.678
-12.217
-481.15%
jan 1, 1994
-13.424
-3.746
38.7%
jan 1, 1995
-11.999
+1.425
-10.62%
jan 1, 1996
-6.429
+5.57
-46.42%
jan 1, 1997
-4.177
+2.252
-35.03%
jan 1, 1998
-14.814
-10.637
254.69%
jan 1, 1999
-18.421
-3.607
24.35%
jan 1, 2000
-24.901
-6.481
35.18%
jan 1, 2001
-21.874
+3.028
-12.16%
jan 1, 2002
-25.216
-3.343
15.28%
jan 1, 2003
-26.355
-1.139
4.52%
jan 1, 2004
-16.254
+10.101
-38.33%
jan 1, 2005
-12.128
+4.126
-25.39%
jan 1, 2006
-1.809
+10.319
-85.09%
jan 1, 2007
4.788
+6.596
-364.7%
jan 1, 2008
5.116
+0.329
6.87%
jan 1, 2009
7.814
+2.698
52.73%
jan 1, 2010
5.865
-1.95
-24.95%
jan 1, 2011
8.203
+2.338
39.87%
jan 1, 2012
9.285
+1.082
13.19%
jan 1, 2013
10.367
+1.082
11.65%
Ranking of countries by current statistics by years