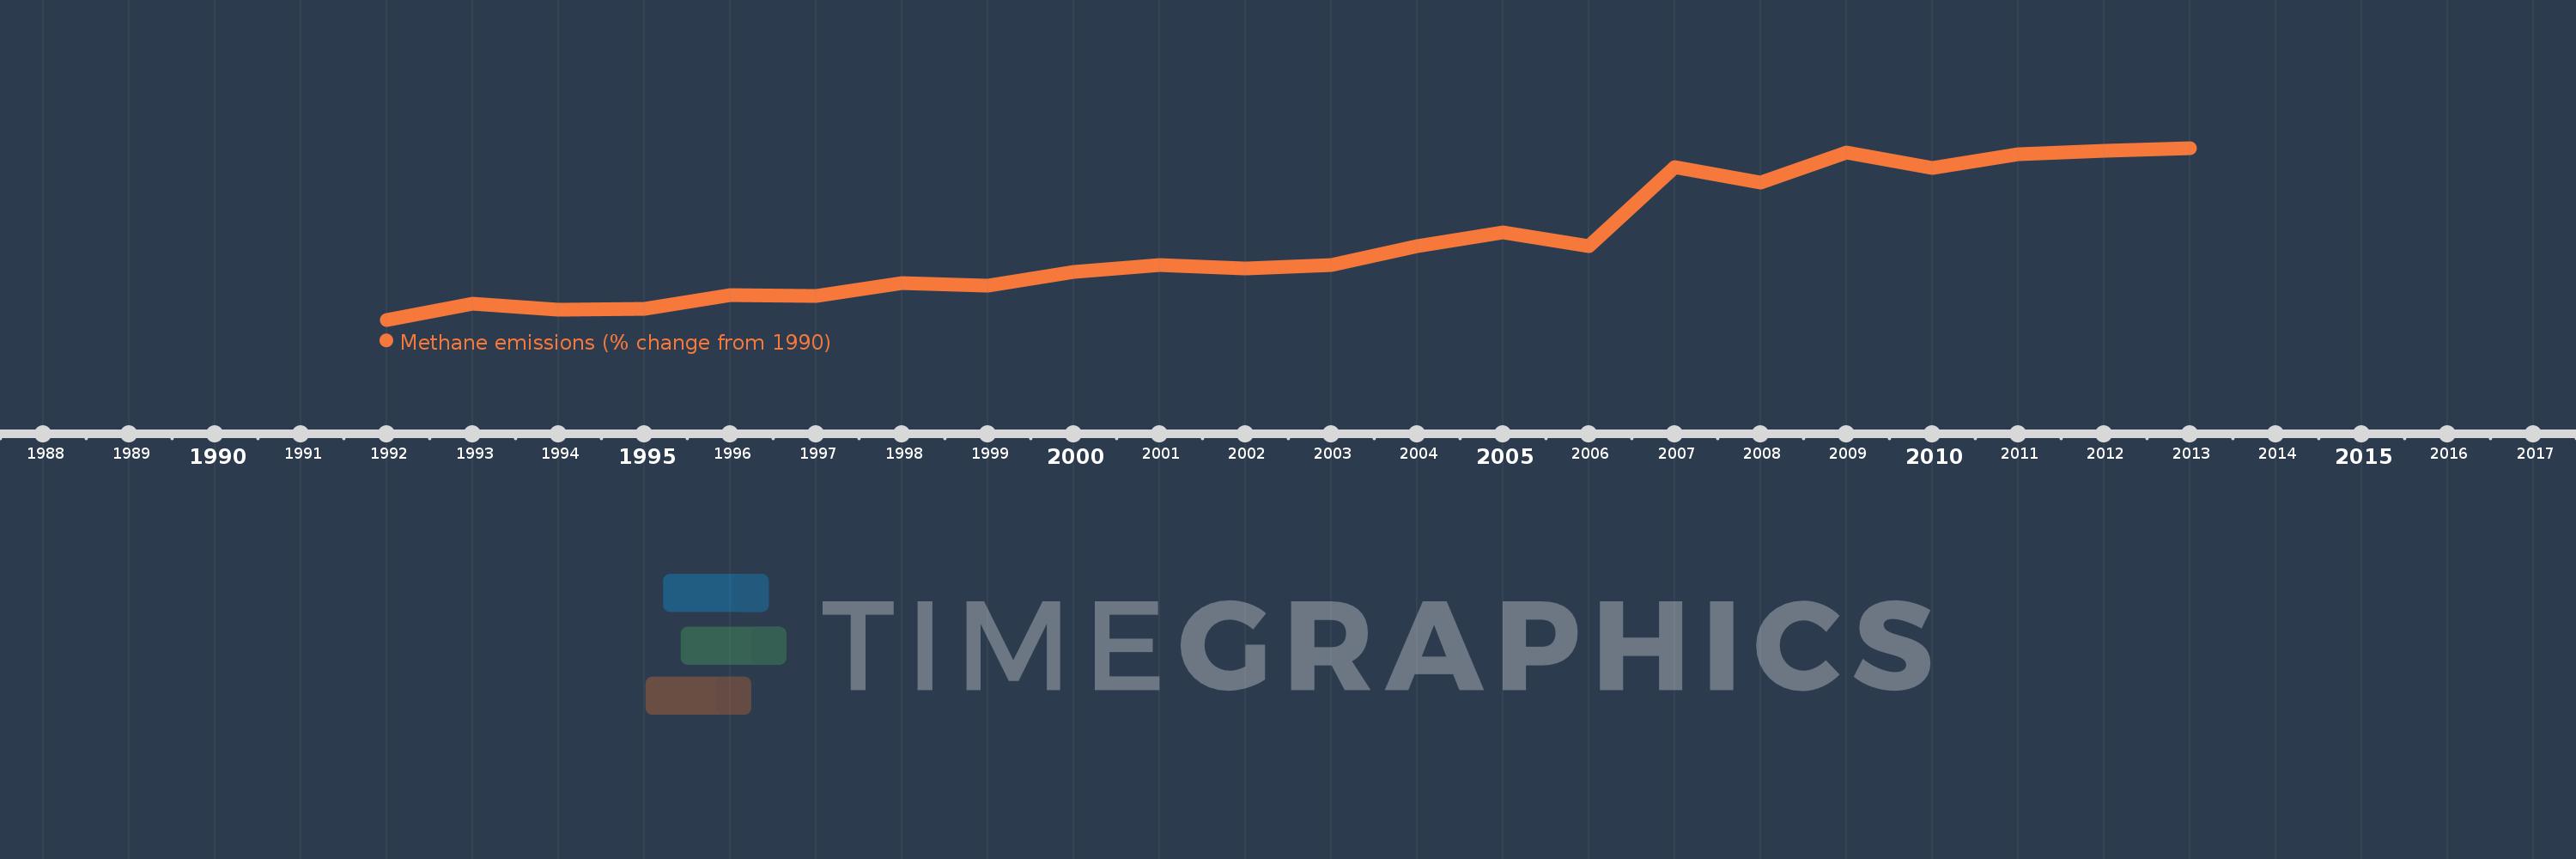
This timeline shows a graph from 1992 to 2013 of Chad. No data until 1991. Number of actual observations by date: 22.
Source name:
World Development Indicators
Source organization:
World Bank staff estimates from original source: European Commission, Joint Research Centre (JRC)/Netherlands Environmental Assessment Agency (PBL). Emission Database for Global Atmospheric Research (EDGAR): http://edgar.jrc.ec.europa.eu/.
Categories, topics:
Climate Change, Environment
Last updated:
apr 23, 2017
Indicators value changes by year
Meaning:
30.931
Minimum:
-12.264
jan 1, 1992
Maximum:
82.951
jan 1, 2013
At the date of observation
Value
Absolute change
Change from the previous value
jan 1, 1992
-12.264
-12.264
0.0%
jan 1, 1993
-3.298
+8.966
-73.11%
jan 1, 1994
-6.721
-3.423
103.78%
jan 1, 1995
-6.32
+0.401
-5.97%
jan 1, 1996
1.23
+7.55
-119.47%
jan 1, 1997
0.917
-0.314
-25.51%
jan 1, 1998
8.069
+7.152
780.33%
jan 1, 1999
6.541
-1.527
-18.93%
jan 1, 2000
14.321
+7.78
118.93%
jan 1, 2001
17.872
+3.551
24.79%
jan 1, 2002
16.333
-1.539
-8.61%
jan 1, 2003
18.171
+1.838
11.25%
jan 1, 2004
28.563
+10.392
57.19%
jan 1, 2005
36.334
+7.772
27.21%
jan 1, 2006
28.672
-7.662
-21.09%
jan 1, 2007
72.409
+43.737
152.54%
jan 1, 2008
63.896
-8.513
-11.76%
jan 1, 2009
80.613
+16.717
26.16%
jan 1, 2010
71.674
-8.939
-11.09%
jan 1, 2011
79.364
+7.69
10.73%
jan 1, 2012
81.157
+1.794
2.26%
jan 1, 2013
82.951
+1.794
2.21%
Ranking of countries by current statistics by years