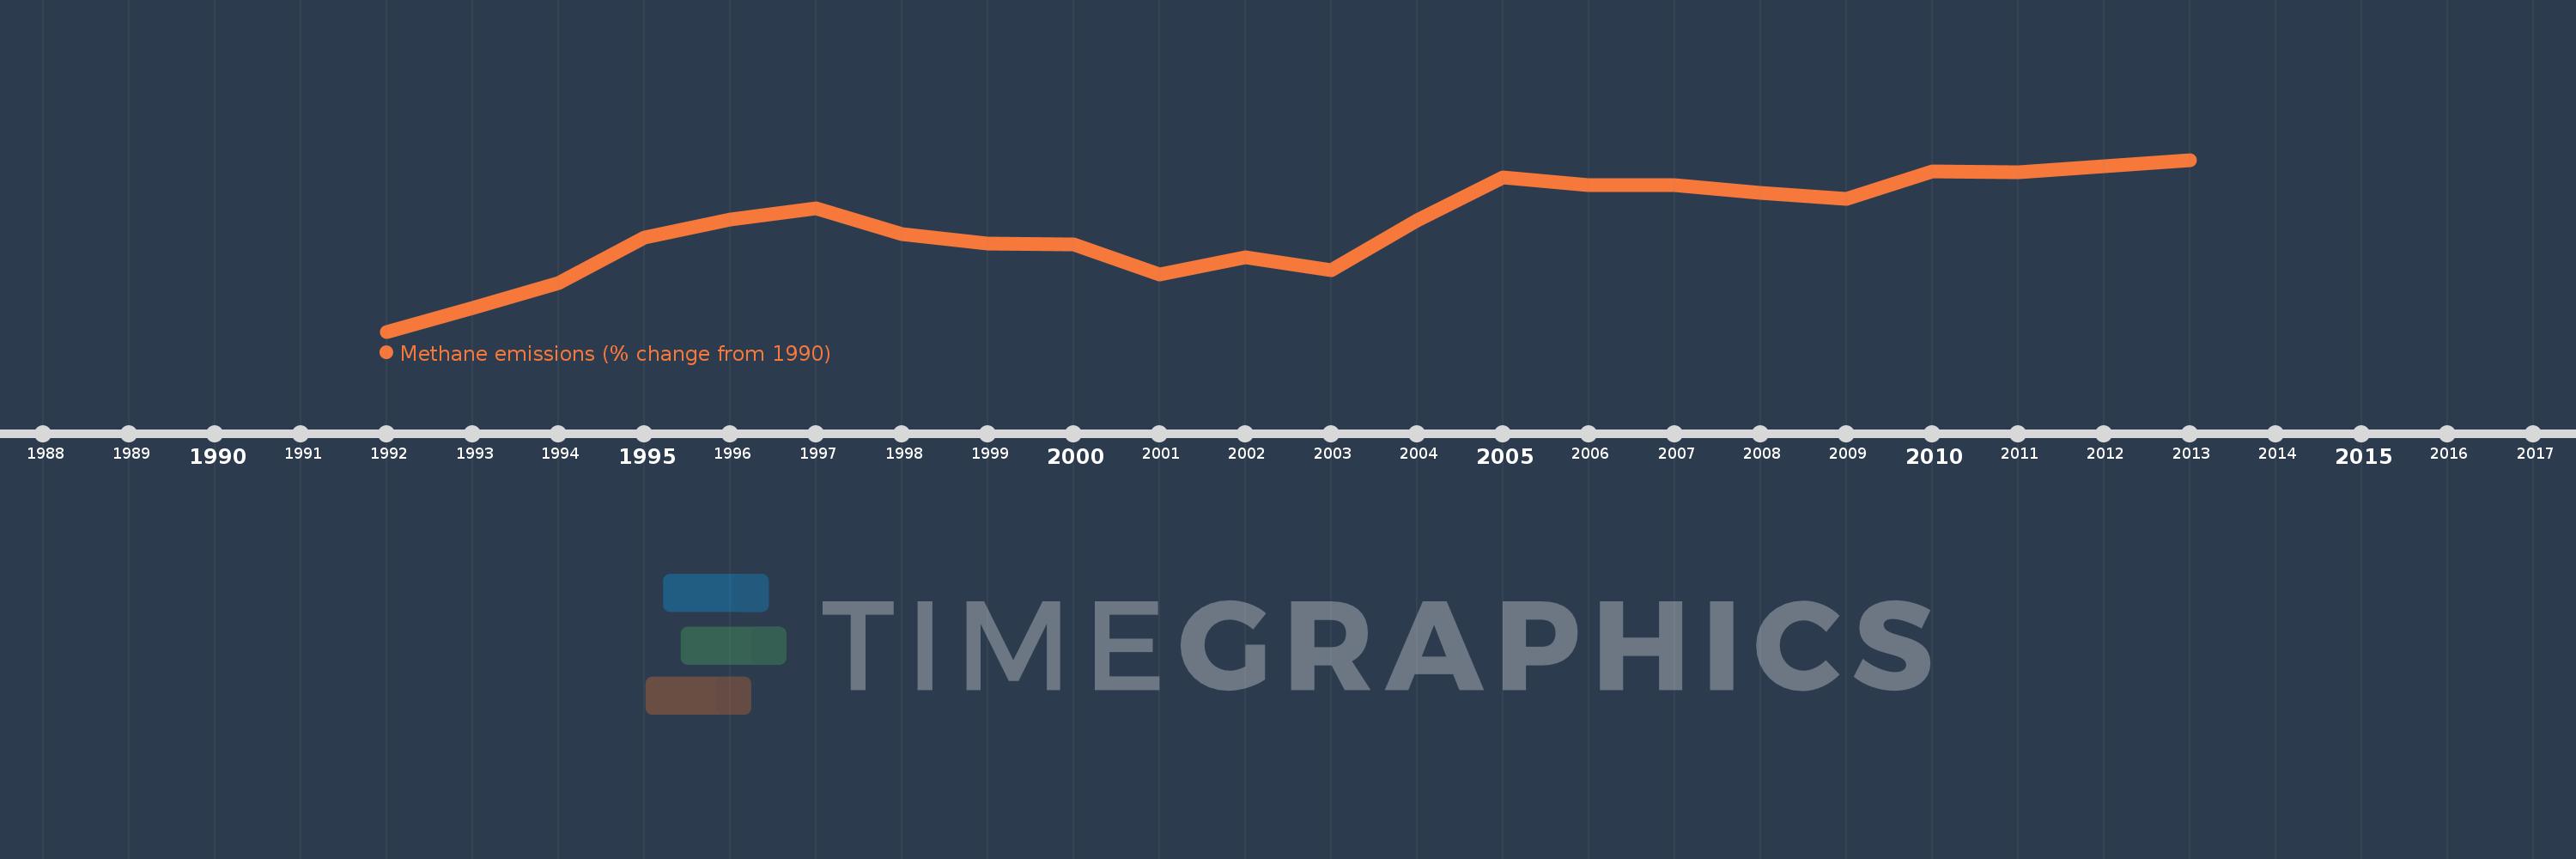
This timeline shows a graph from 1992 to 2013 of Ecuador. No data until 1991. Number of actual observations by date: 22.
Source name:
World Development Indicators
Source organization:
World Bank staff estimates from original source: European Commission, Joint Research Centre (JRC)/Netherlands Environmental Assessment Agency (PBL). Emission Database for Global Atmospheric Research (EDGAR): http://edgar.jrc.ec.europa.eu/.
Categories, topics:
Climate Change, Environment
Last updated:
apr 23, 2017
Indicators value changes by year
Meaning:
28.559
Minimum:
3.626
jan 1, 1992
Maximum:
43.679
jan 1, 2013
At the date of observation
Value
Absolute change
Change from the previous value
jan 1, 1992
3.626
+3.626
0.0%
jan 1, 1993
9.08
+5.454
150.4%
jan 1, 1994
14.91
+5.83
64.21%
jan 1, 1995
25.504
+10.594
71.05%
jan 1, 1996
29.766
+4.262
16.71%
jan 1, 1997
32.296
+2.529
8.5%
jan 1, 1998
26.361
-5.935
-18.38%
jan 1, 1999
24.174
-2.186
-8.29%
jan 1, 2000
23.921
-0.254
-1.05%
jan 1, 2001
16.957
-6.964
-29.11%
jan 1, 2002
20.976
+4.019
23.7%
jan 1, 2003
17.972
-3.004
-14.32%
jan 1, 2004
29.485
+11.513
64.06%
jan 1, 2005
39.571
+10.085
34.2%
jan 1, 2006
37.745
-1.826
-4.61%
jan 1, 2007
37.748
+0.003
0.01%
jan 1, 2008
35.907
-1.84
-4.88%
jan 1, 2009
34.52
-1.387
-3.86%
jan 1, 2010
40.972
+6.452
18.69%
jan 1, 2011
40.862
-0.11
-0.27%
jan 1, 2012
42.271
+1.409
3.45%
jan 1, 2013
43.679
+1.409
3.33%
Ranking of countries by current statistics by years