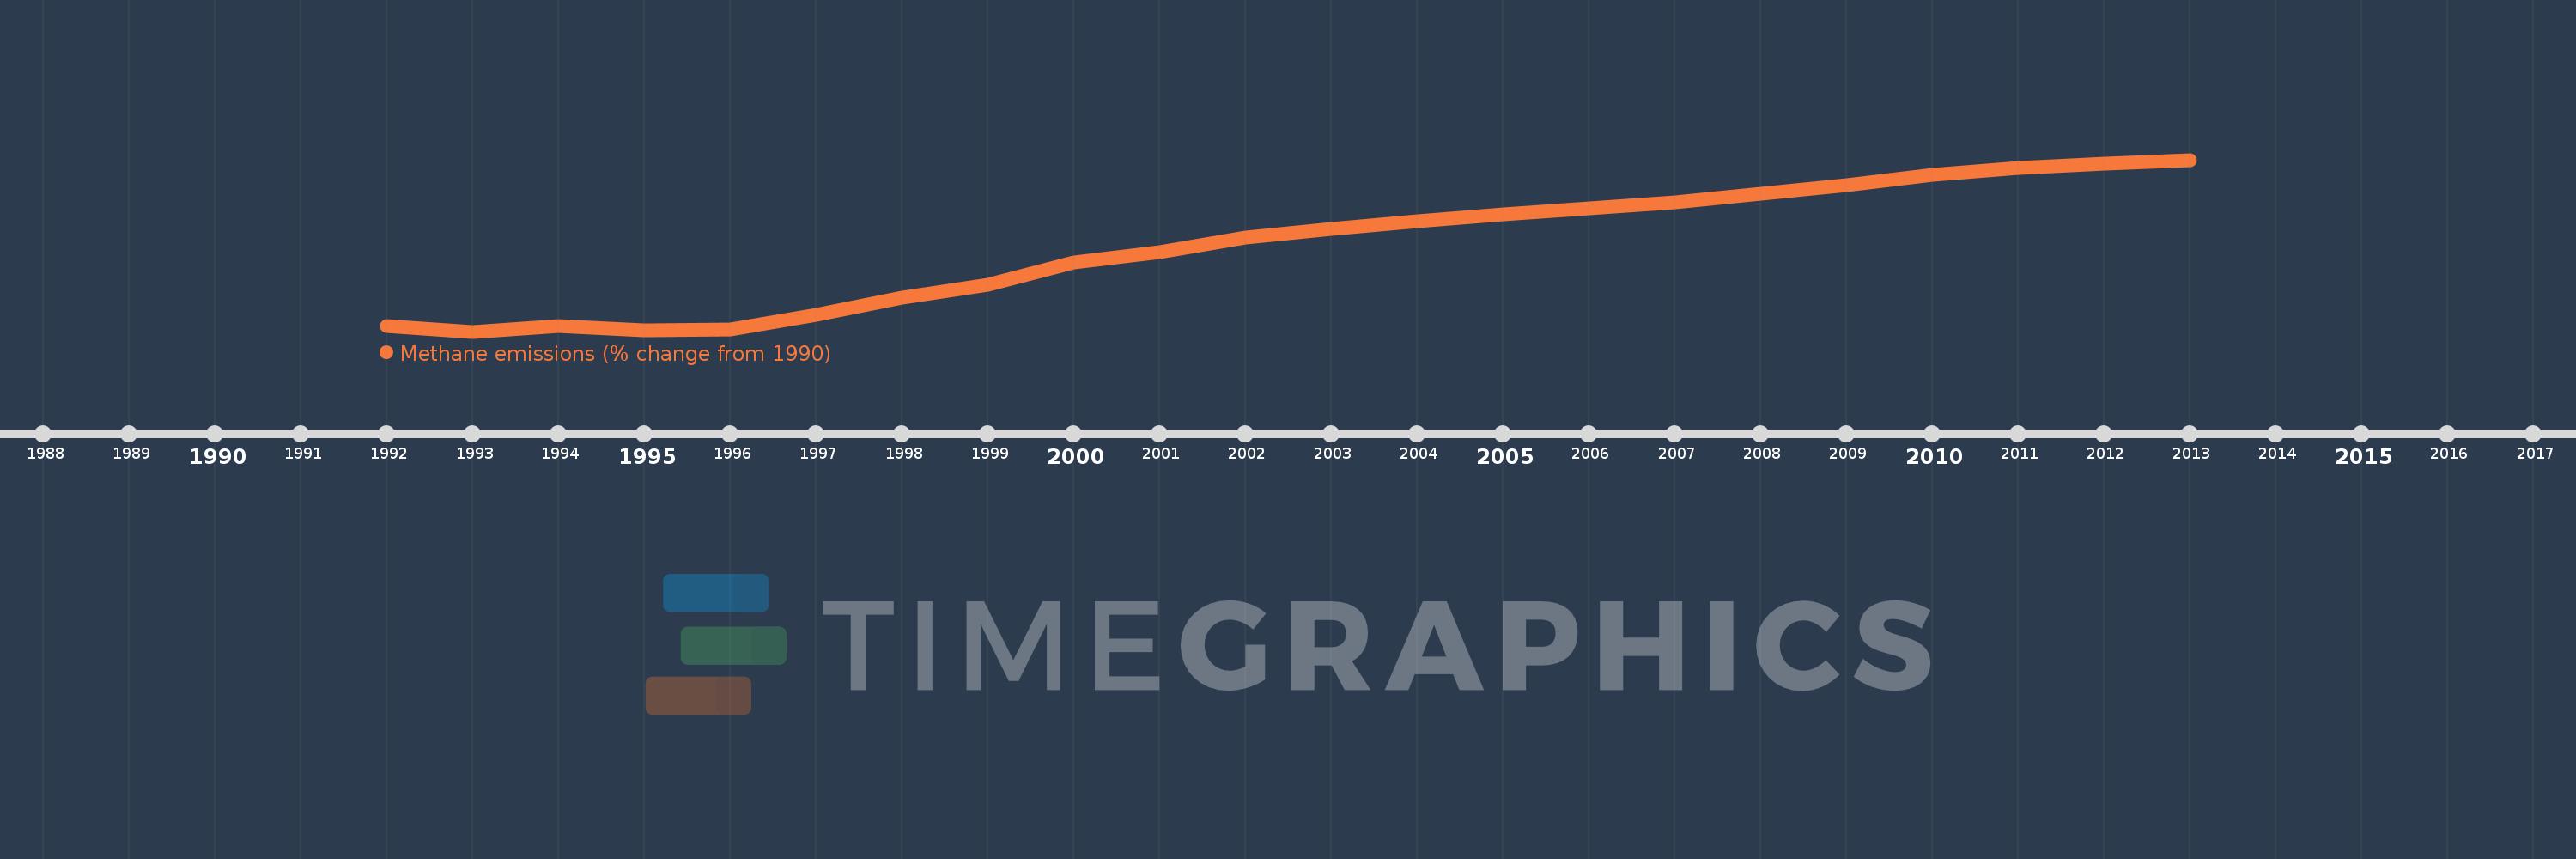
This timeline shows a graph from 1992 to 2013 of Mauritania. No data until 1991. Number of actual observations by date: 22.
Source name:
World Development Indicators
Source organization:
World Bank staff estimates from original source: European Commission, Joint Research Centre (JRC)/Netherlands Environmental Assessment Agency (PBL). Emission Database for Global Atmospheric Research (EDGAR): http://edgar.jrc.ec.europa.eu/.
Categories, topics:
Climate Change, Environment
Last updated:
apr 23, 2017
Indicators value changes by year
Meaning:
36.093
Minimum:
0.84
jan 1, 1993
Maximum:
71.643
jan 1, 2013
At the date of observation
Value
Absolute change
Change from the previous value
jan 1, 1992
3.178
+3.178
0.0%
jan 1, 1993
0.84
-2.338
-73.56%
jan 1, 1994
3.065
+2.225
264.83%
jan 1, 1995
1.365
-1.7
-55.46%
jan 1, 1996
1.902
+0.537
39.34%
jan 1, 1997
7.687
+5.784
304.08%
jan 1, 1998
14.986
+7.3
94.97%
jan 1, 1999
20.099
+5.113
34.12%
jan 1, 2000
29.211
+9.111
45.33%
jan 1, 2001
33.65
+4.439
15.2%
jan 1, 2002
39.492
+5.842
17.36%
jan 1, 2003
43.096
+3.604
9.13%
jan 1, 2004
46.441
+3.344
7.76%
jan 1, 2005
49.156
+2.715
5.85%
jan 1, 2006
51.495
+2.339
4.76%
jan 1, 2007
54.192
+2.697
5.24%
jan 1, 2008
57.76
+3.568
6.58%
jan 1, 2009
61.265
+3.505
6.07%
jan 1, 2010
65.279
+4.014
6.55%
jan 1, 2011
68.277
+2.998
4.59%
jan 1, 2012
69.96
+1.683
2.46%
jan 1, 2013
71.643
+1.683
2.41%
Ranking of countries by current statistics by years