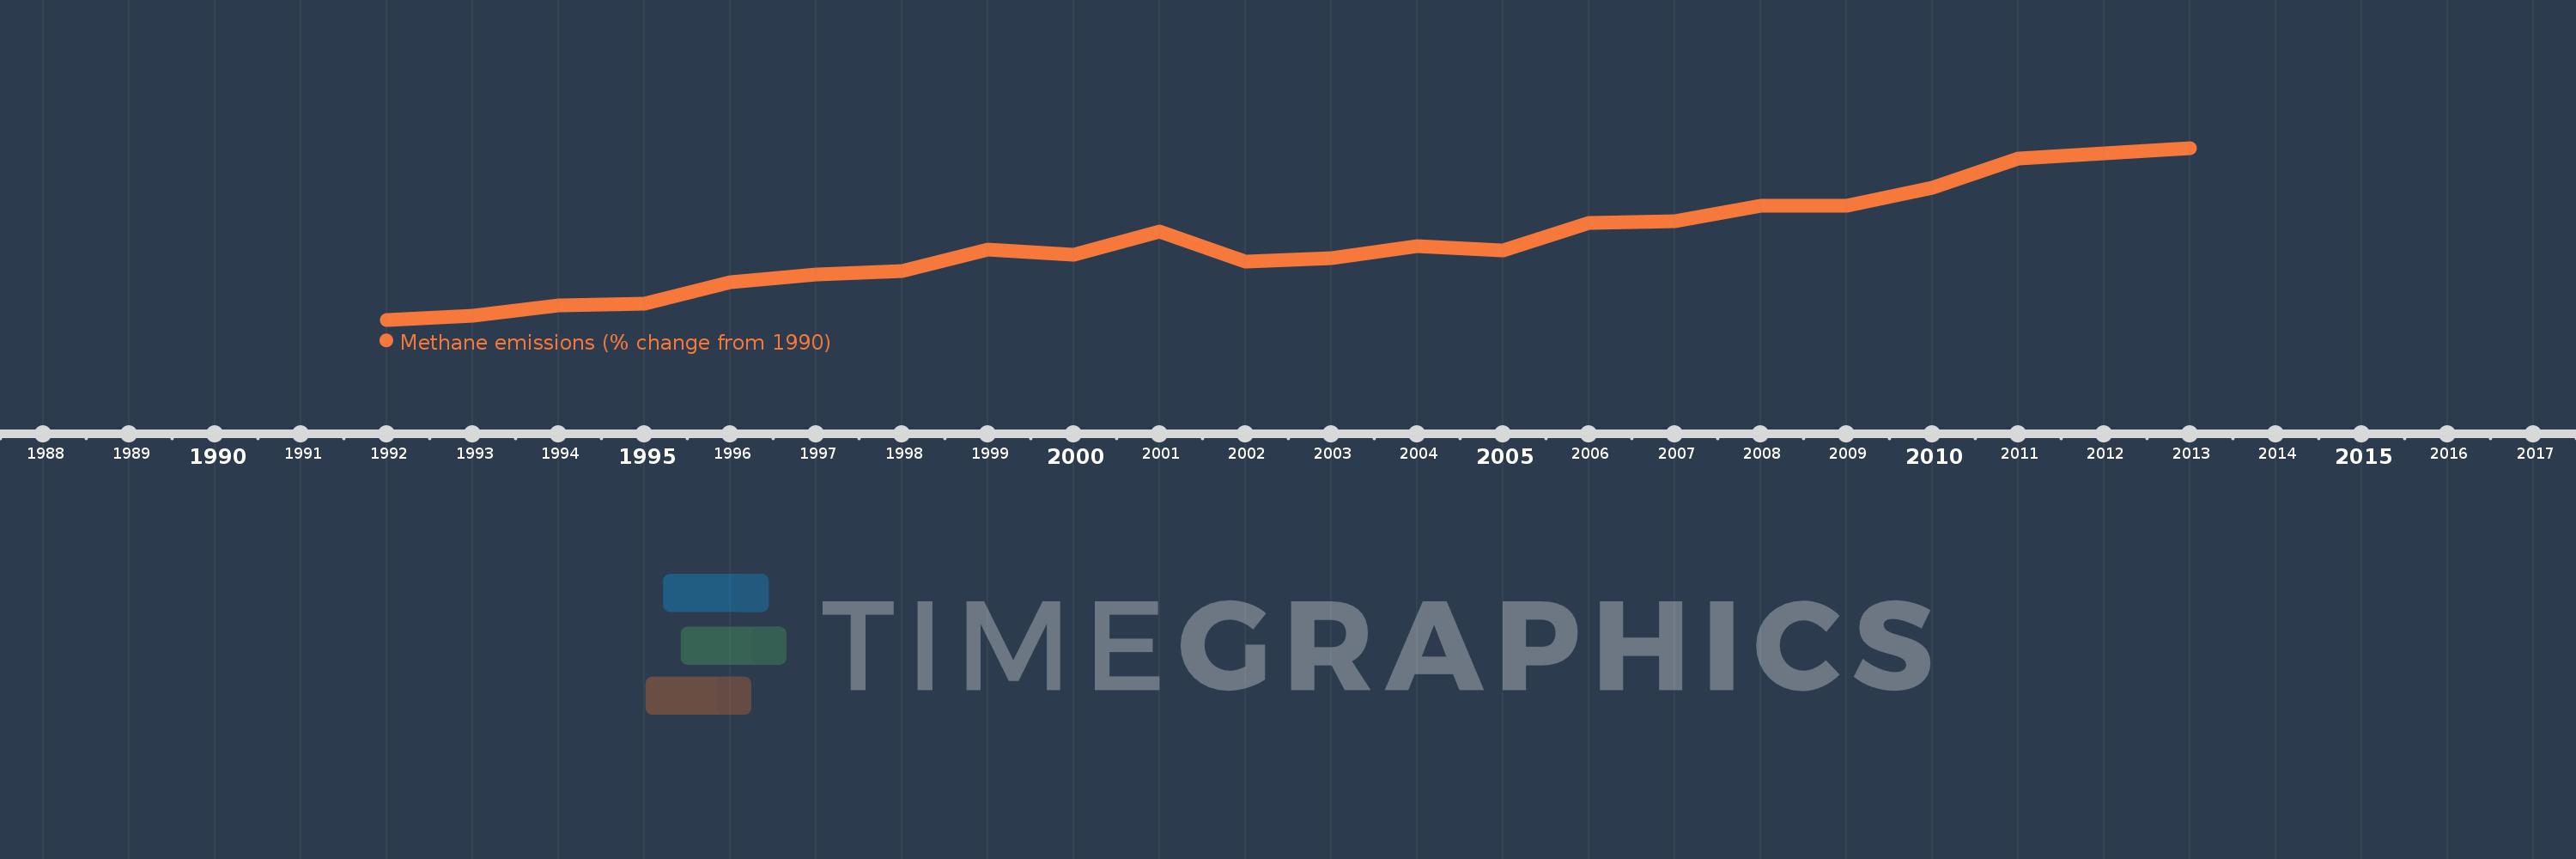
This timeline shows a graph from 1992 to 2013 of Peru. No data until 1991. Number of actual observations by date: 22.
Source name:
World Development Indicators
Source organization:
World Bank staff estimates from original source: European Commission, Joint Research Centre (JRC)/Netherlands Environmental Assessment Agency (PBL). Emission Database for Global Atmospheric Research (EDGAR): http://edgar.jrc.ec.europa.eu/.
Categories, topics:
Climate Change, Environment
Last updated:
apr 23, 2017
Indicators value changes by year
Meaning:
17.729
Minimum:
-2.505
jan 1, 1992
Maximum:
42.326
jan 1, 2013
At the date of observation
Value
Absolute change
Change from the previous value
jan 1, 1992
-2.505
-2.505
0.0%
jan 1, 1993
-1.349
+1.155
-46.12%
jan 1, 1994
1.131
+2.48
-183.79%
jan 1, 1995
1.709
+0.578
51.14%
jan 1, 1996
7.203
+5.494
321.51%
jan 1, 1997
9.301
+2.097
29.11%
jan 1, 1998
10.101
+0.8
8.6%
jan 1, 1999
15.778
+5.678
56.21%
jan 1, 2000
14.388
-1.39
-8.81%
jan 1, 2001
20.457
+6.068
42.17%
jan 1, 2002
12.568
-7.888
-38.56%
jan 1, 2003
13.608
+1.039
8.27%
jan 1, 2004
16.788
+3.18
23.37%
jan 1, 2005
15.588
-1.199
-7.14%
jan 1, 2006
22.841
+7.253
46.53%
jan 1, 2007
23.178
+0.337
1.47%
jan 1, 2008
27.206
+4.029
17.38%
jan 1, 2009
27.314
+0.108
0.4%
jan 1, 2010
31.952
+4.639
16.98%
jan 1, 2011
39.535
+7.583
23.73%
jan 1, 2012
40.931
+1.395
3.53%
jan 1, 2013
42.326
+1.395
3.41%
Ranking of countries by current statistics by years