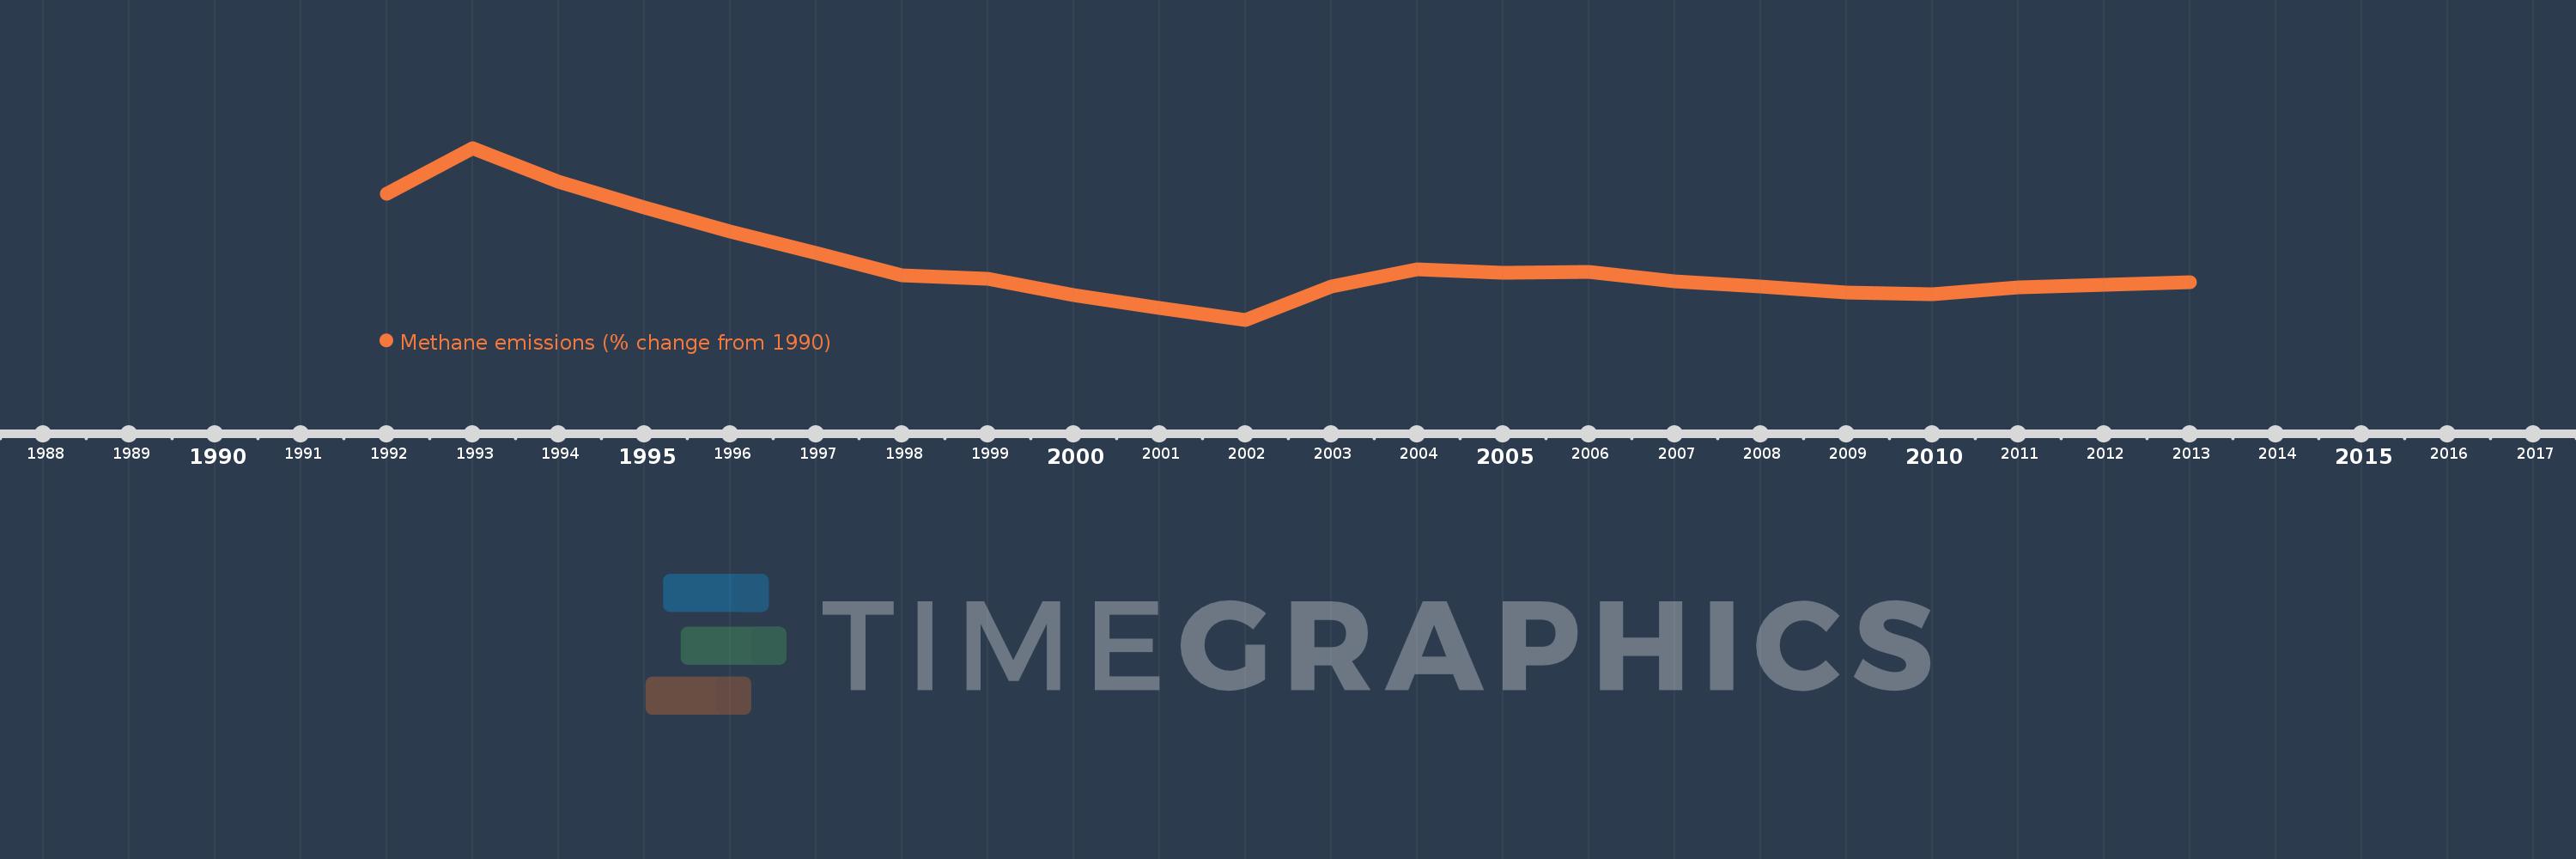
This timeline shows a graph from 1992 to 2013 of Moldova. No data until 1991. Number of actual observations by date: 22.
Source name:
World Development Indicators
Source organization:
World Bank staff estimates from original source: European Commission, Joint Research Centre (JRC)/Netherlands Environmental Assessment Agency (PBL). Emission Database for Global Atmospheric Research (EDGAR): http://edgar.jrc.ec.europa.eu/.
Categories, topics:
Climate Change, Environment
Last updated:
apr 23, 2017
Indicators value changes by year
Meaning:
-11.731
Minimum:
-22.659
jan 1, 2002
Maximum:
10.851
jan 1, 1993
At the date of observation
Value
Absolute change
Change from the previous value
jan 1, 1992
1.969
+1.969
0.0%
jan 1, 1993
10.851
+8.882
451.12%
jan 1, 1994
4.257
-6.594
-60.77%
jan 1, 1995
-0.783
-5.04
-118.41%
jan 1, 1996
-5.445
-4.662
595.03%
jan 1, 1997
-9.624
-4.178
76.73%
jan 1, 1998
-13.99
-4.366
45.36%
jan 1, 1999
-14.612
-0.623
4.45%
jan 1, 2000
-17.885
-3.273
22.4%
jan 1, 2001
-20.368
-2.483
13.88%
jan 1, 2002
-22.659
-2.291
11.25%
jan 1, 2003
-16.112
+6.547
-28.89%
jan 1, 2004
-12.756
+3.356
-20.83%
jan 1, 2005
-13.48
-0.724
5.67%
jan 1, 2006
-13.381
+0.099
-0.74%
jan 1, 2007
-15.098
-1.717
12.83%
jan 1, 2008
-16.157
-1.059
7.01%
jan 1, 2009
-17.37
-1.213
7.5%
jan 1, 2010
-17.707
-0.337
1.94%
jan 1, 2011
-16.412
+1.295
-7.31%
jan 1, 2012
-15.912
+0.5
-3.04%
jan 1, 2013
-15.413
+0.5
-3.14%
Ranking of countries by current statistics by years