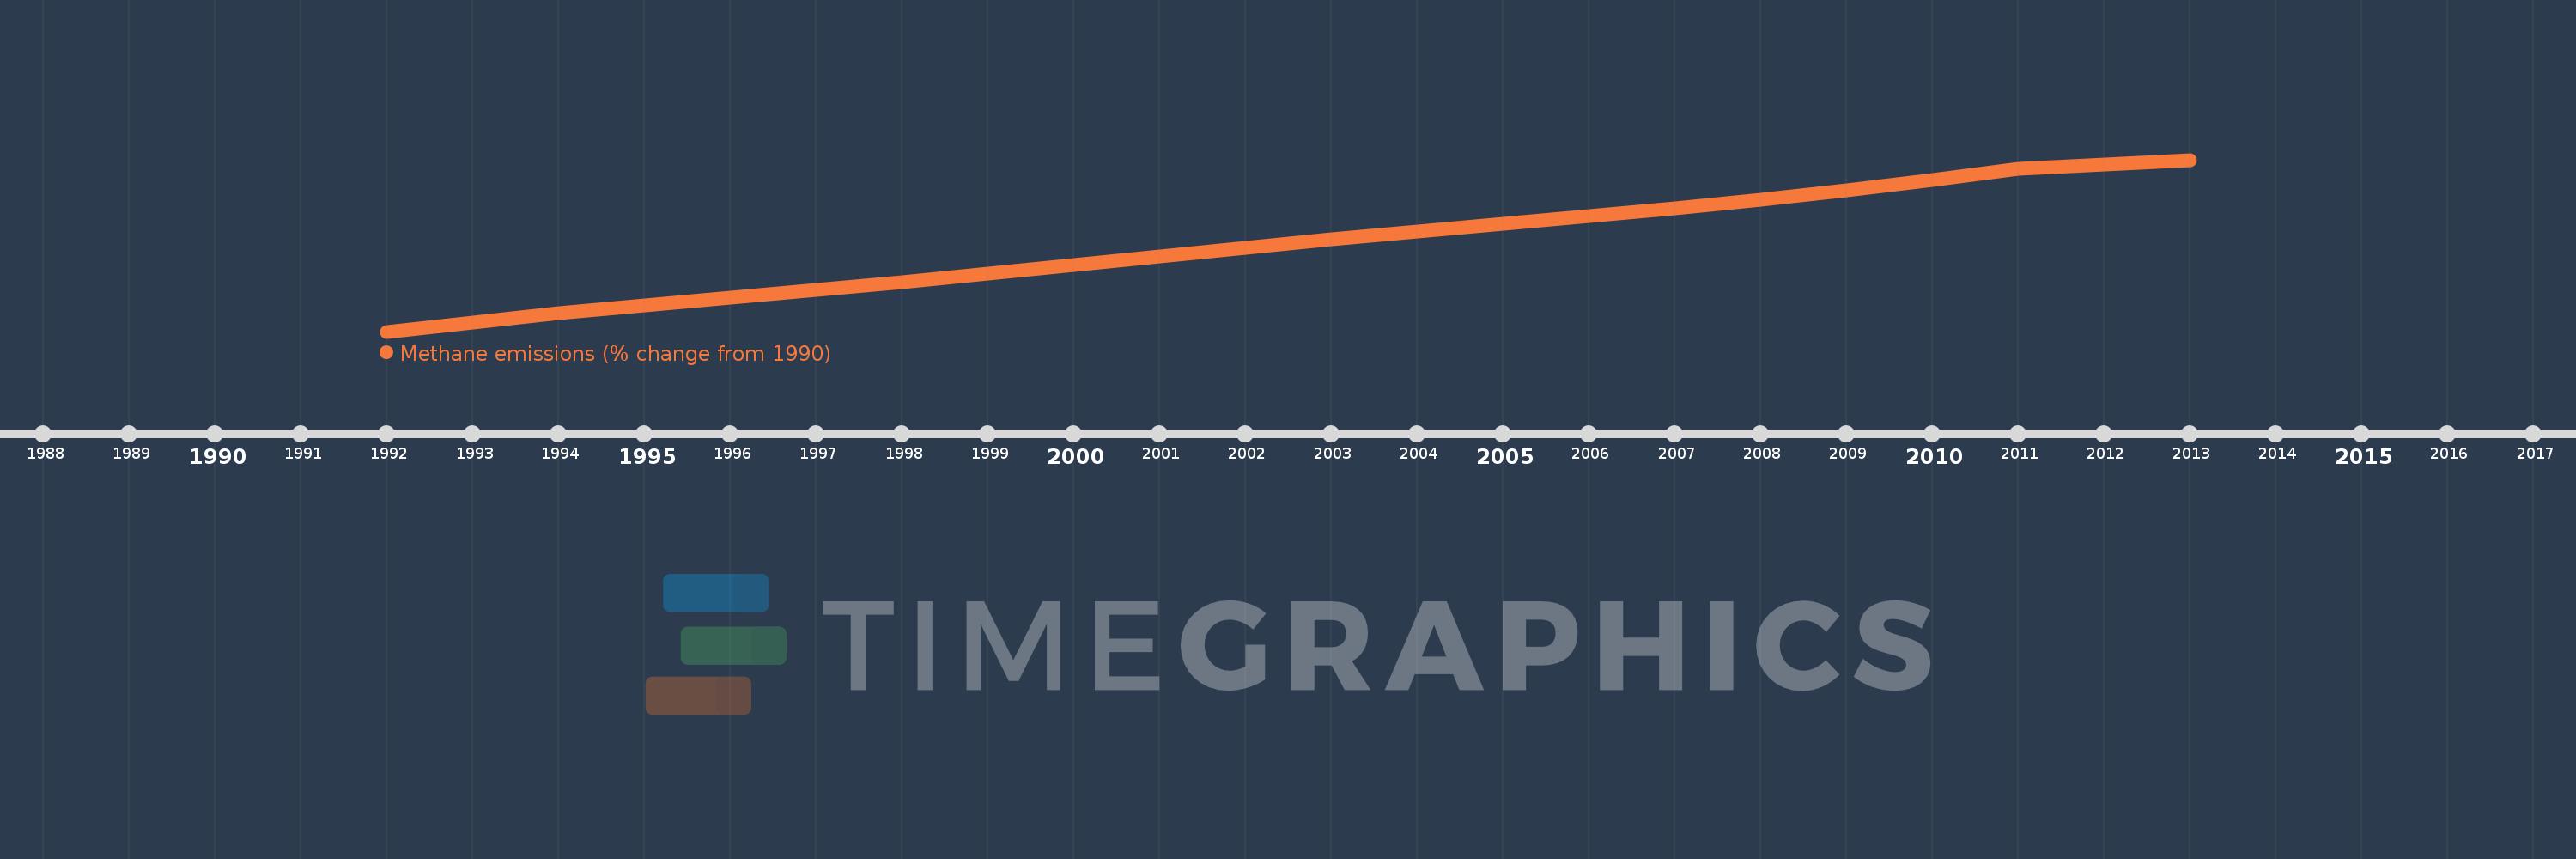
This timeline shows a graph from 1992 to 2013 of Nauru. No data until 1991. Number of actual observations by date: 22.
Source name:
World Development Indicators
Source organization:
World Bank staff estimates from original source: European Commission, Joint Research Centre (JRC)/Netherlands Environmental Assessment Agency (PBL). Emission Database for Global Atmospheric Research (EDGAR): http://edgar.jrc.ec.europa.eu/.
Categories, topics:
Climate Change, Environment
Last updated:
apr 23, 2017
Indicators value changes by year
Meaning:
36.572
Minimum:
4.17
jan 1, 1992
Maximum:
67.803
jan 1, 2013
At the date of observation
Value
Absolute change
Change from the previous value
jan 1, 1992
4.17
+4.17
0.0%
jan 1, 1993
7.572
+3.401
81.56%
jan 1, 1994
10.89
+3.318
43.82%
jan 1, 1995
13.736
+2.846
26.14%
jan 1, 1996
16.706
+2.97
21.62%
jan 1, 1997
19.444
+2.738
16.39%
jan 1, 1998
22.339
+2.894
14.89%
jan 1, 1999
25.523
+3.184
14.26%
jan 1, 2000
28.719
+3.196
12.52%
jan 1, 2001
31.91
+3.191
11.11%
jan 1, 2002
35.202
+3.292
10.32%
jan 1, 2003
38.231
+3.03
8.61%
jan 1, 2004
41.11
+2.878
7.53%
jan 1, 2005
44.07
+2.96
7.2%
jan 1, 2006
47.045
+2.975
6.75%
jan 1, 2007
49.689
+2.645
5.62%
jan 1, 2008
52.943
+3.254
6.55%
jan 1, 2009
56.477
+3.533
6.67%
jan 1, 2010
60.335
+3.858
6.83%
jan 1, 2011
64.513
+4.178
6.92%
jan 1, 2012
66.158
+1.645
2.55%
jan 1, 2013
67.803
+1.645
2.49%
Ranking of countries by current statistics by years