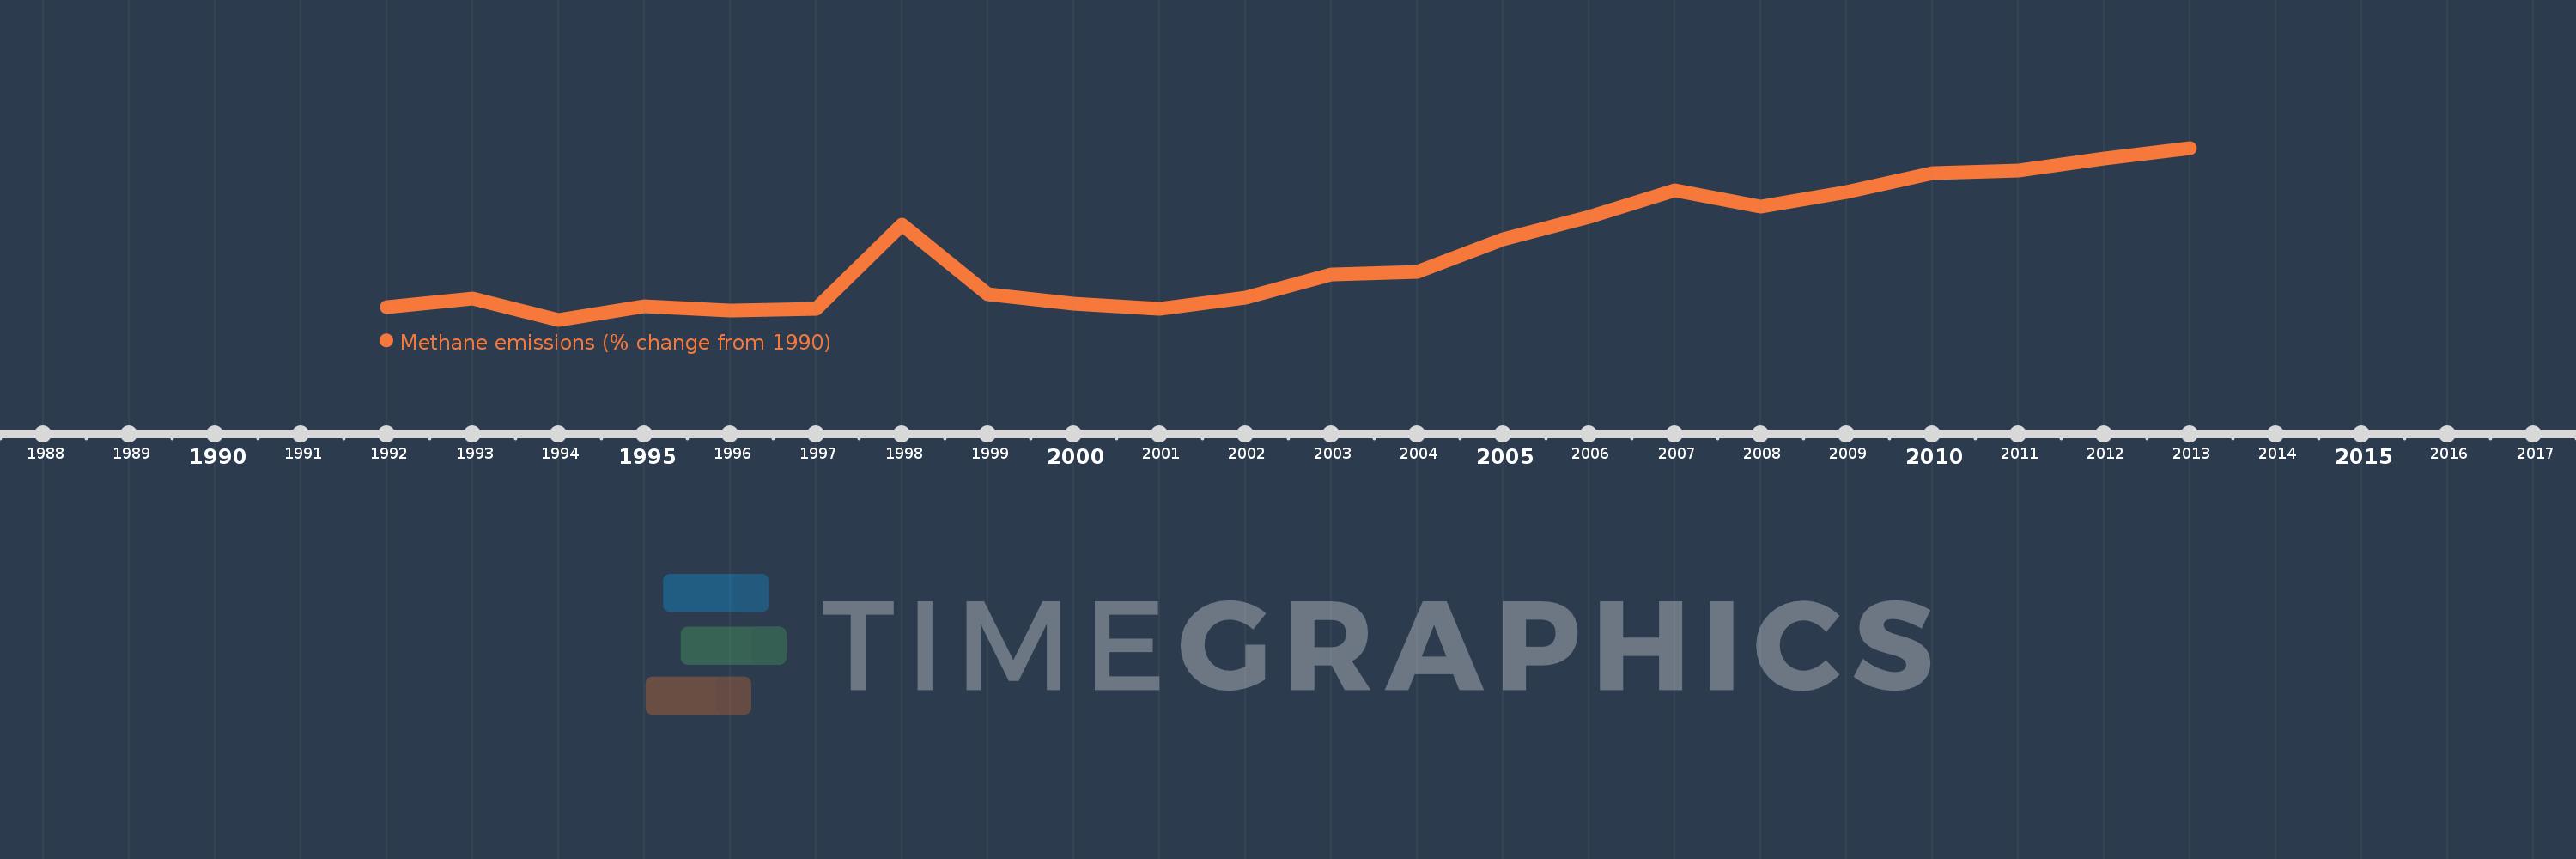
This timeline shows a graph from 1992 to 2013 of Middle income. No data until 1991. Number of actual observations by date: 22.
Source name:
World Development Indicators
Source organization:
World Bank staff estimates from original source: European Commission, Joint Research Centre (JRC)/Netherlands Environmental Assessment Agency (PBL). Emission Database for Global Atmospheric Research (EDGAR): http://edgar.jrc.ec.europa.eu/.
Categories, topics:
Climate Change, Environment
Last updated:
apr 23, 2017
Indicators value changes by year
Meaning:
15.844
Minimum:
0.449
jan 1, 1994
Maximum:
38.919
jan 1, 2013
At the date of observation
Value
Absolute change
Change from the previous value
jan 1, 1992
3.207
+3.207
0.0%
jan 1, 1993
5.26
+2.053
64.03%
jan 1, 1994
0.449
-4.811
-91.47%
jan 1, 1995
3.482
+3.034
676.36%
jan 1, 1996
2.483
-0.999
-28.69%
jan 1, 1997
2.869
+0.386
15.53%
jan 1, 1998
21.682
+18.813
655.72%
jan 1, 1999
6.181
-15.501
-71.49%
jan 1, 2000
4.107
-2.074
-33.56%
jan 1, 2001
2.933
-1.173
-28.57%
jan 1, 2002
5.421
+2.487
84.79%
jan 1, 2003
10.646
+5.225
96.39%
jan 1, 2004
11.12
+0.475
4.46%
jan 1, 2005
18.418
+7.297
65.62%
jan 1, 2006
23.561
+5.144
27.93%
jan 1, 2007
29.465
+5.904
25.06%
jan 1, 2008
25.849
-3.616
-12.27%
jan 1, 2009
29.016
+3.166
12.25%
jan 1, 2010
33.208
+4.193
14.45%
jan 1, 2011
33.777
+0.569
1.71%
jan 1, 2012
36.51
+2.733
8.09%
jan 1, 2013
38.919
+2.41
6.6%
Ranking of countries by current statistics by years