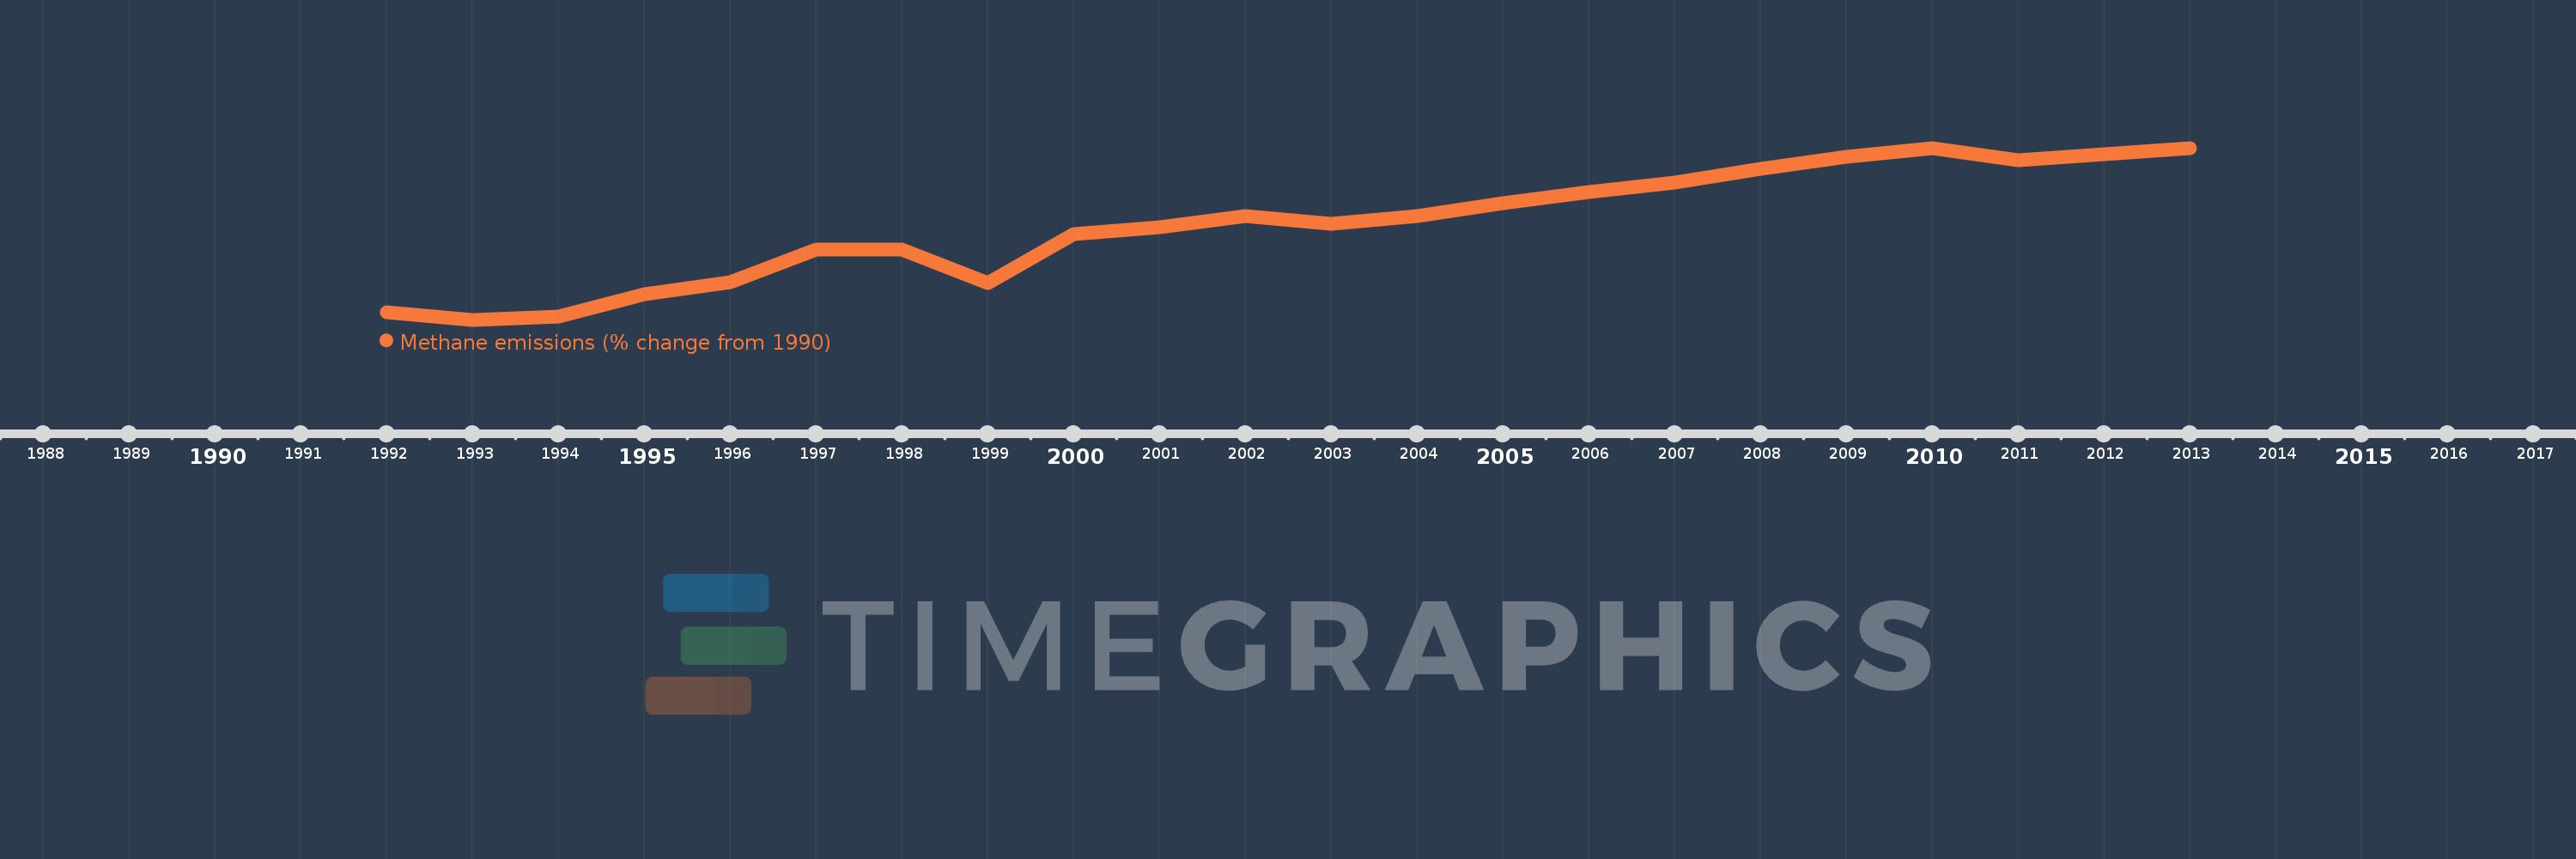
This timeline shows a graph from 1992 to 2013 of Philippines. No data until 1991. Number of actual observations by date: 22.
Source name:
World Development Indicators
Source organization:
World Bank staff estimates from original source: European Commission, Joint Research Centre (JRC)/Netherlands Environmental Assessment Agency (PBL). Emission Database for Global Atmospheric Research (EDGAR): http://edgar.jrc.ec.europa.eu/.
Categories, topics:
Climate Change, Environment
Last updated:
apr 23, 2017
Indicators value changes by year
Meaning:
20.668
Minimum:
-0.551
jan 1, 1993
Maximum:
37.72
jan 1, 2010
At the date of observation
Value
Absolute change
Change from the previous value
jan 1, 1992
1.112
+1.112
0.0%
jan 1, 1993
-0.551
-1.663
-149.51%
jan 1, 1994
0.13
+0.681
-123.6%
jan 1, 1995
5.151
+5.021
3.86K%
jan 1, 1996
7.819
+2.668
51.78%
jan 1, 1997
15.169
+7.35
94.01%
jan 1, 1998
15.158
-0.011
-0.07%
jan 1, 1999
7.575
-7.583
-50.03%
jan 1, 2000
18.462
+10.887
143.73%
jan 1, 2001
20.13
+1.668
9.04%
jan 1, 2002
22.592
+2.462
12.23%
jan 1, 2003
20.748
-1.843
-8.16%
jan 1, 2004
22.467
+1.719
8.28%
jan 1, 2005
25.496
+3.029
13.48%
jan 1, 2006
27.981
+2.485
9.75%
jan 1, 2007
30.003
+2.022
7.23%
jan 1, 2008
33.093
+3.09
10.3%
jan 1, 2009
35.695
+2.602
7.86%
jan 1, 2010
37.72
+2.025
5.67%
jan 1, 2011
34.902
-2.817
-7.47%
jan 1, 2012
36.251
+1.349
3.87%
jan 1, 2013
37.6
+1.349
3.72%
Ranking of countries by current statistics by years