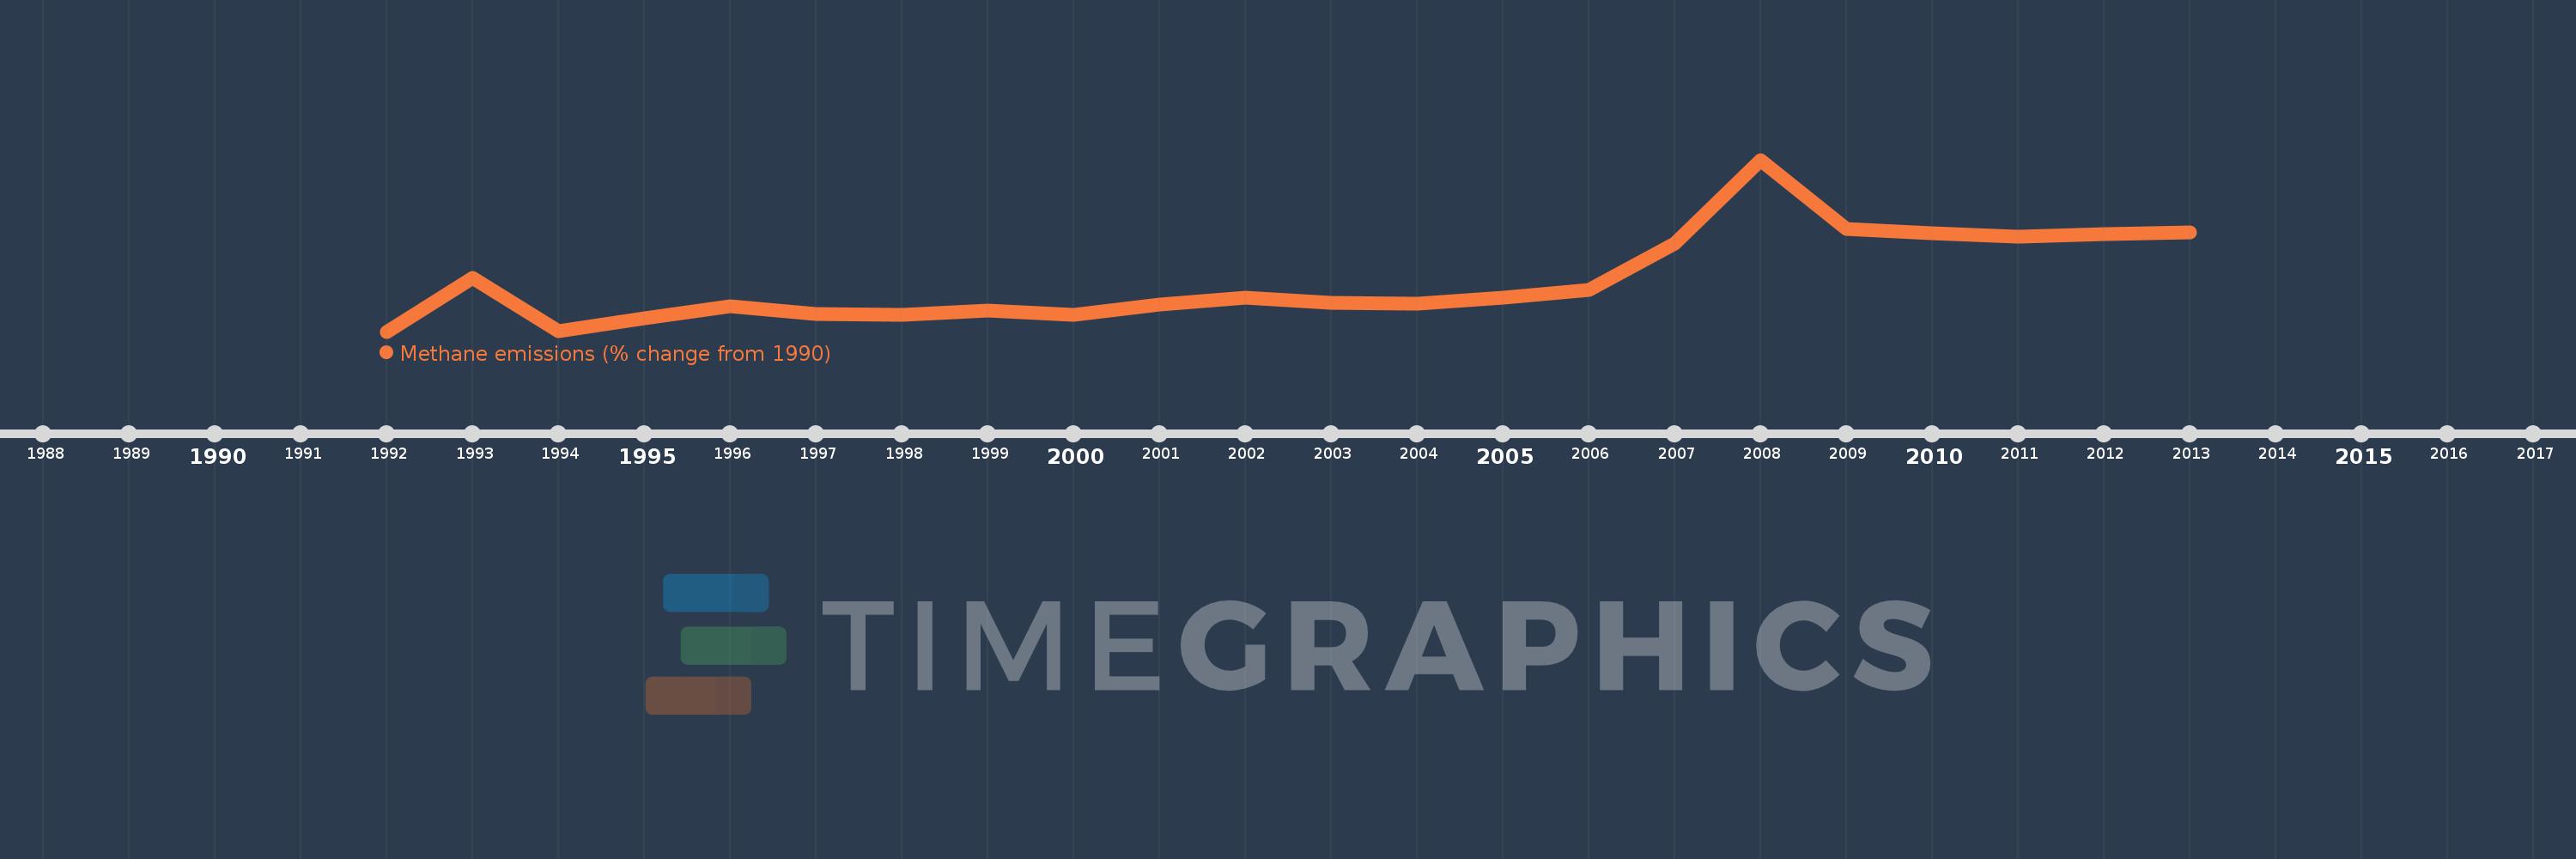
This timeline shows a graph from 1992 to 2013 of Sub-Saharan Africa . No data until 1991. Number of actual observations by date: 22.
Source name:
World Development Indicators
Source organization:
World Bank staff estimates from original source: European Commission, Joint Research Centre (JRC)/Netherlands Environmental Assessment Agency (PBL). Emission Database for Global Atmospheric Research (EDGAR): http://edgar.jrc.ec.europa.eu/.
Categories, topics:
Climate Change, Environment
Last updated:
apr 23, 2017
Indicators value changes by year
Meaning:
11.089
Minimum:
-11.352
jan 1, 1992
Maximum:
65.066
jan 1, 2008
At the date of observation
Value
Absolute change
Change from the previous value
jan 1, 1992
-11.352
-11.352
0.0%
jan 1, 1993
12.382
+23.734
-209.08%
jan 1, 1994
-11.222
-23.605
-190.63%
jan 1, 1995
-5.566
+5.657
-50.4%
jan 1, 1996
-0.217
+5.348
-96.09%
jan 1, 1997
-3.34
-3.123
1.44K%
jan 1, 1998
-3.901
-0.561
16.78%
jan 1, 1999
-1.942
+1.959
-50.22%
jan 1, 2000
-3.922
-1.98
101.95%
jan 1, 2001
0.768
+4.69
-119.58%
jan 1, 2002
3.602
+2.834
369.02%
jan 1, 2003
1.412
-2.19
-60.79%
jan 1, 2004
1.045
-0.368
-26.04%
jan 1, 2005
3.819
+2.775
265.62%
jan 1, 2006
7.023
+3.204
83.89%
jan 1, 2007
27.717
+20.694
294.65%
jan 1, 2008
65.066
+37.349
134.75%
jan 1, 2009
34.478
-30.589
-47.01%
jan 1, 2010
32.354
-2.124
-6.16%
jan 1, 2011
30.876
-1.477
-4.57%
jan 1, 2012
31.915
+1.038
3.36%
jan 1, 2013
32.953
+1.038
3.25%
Ranking of countries by current statistics by years