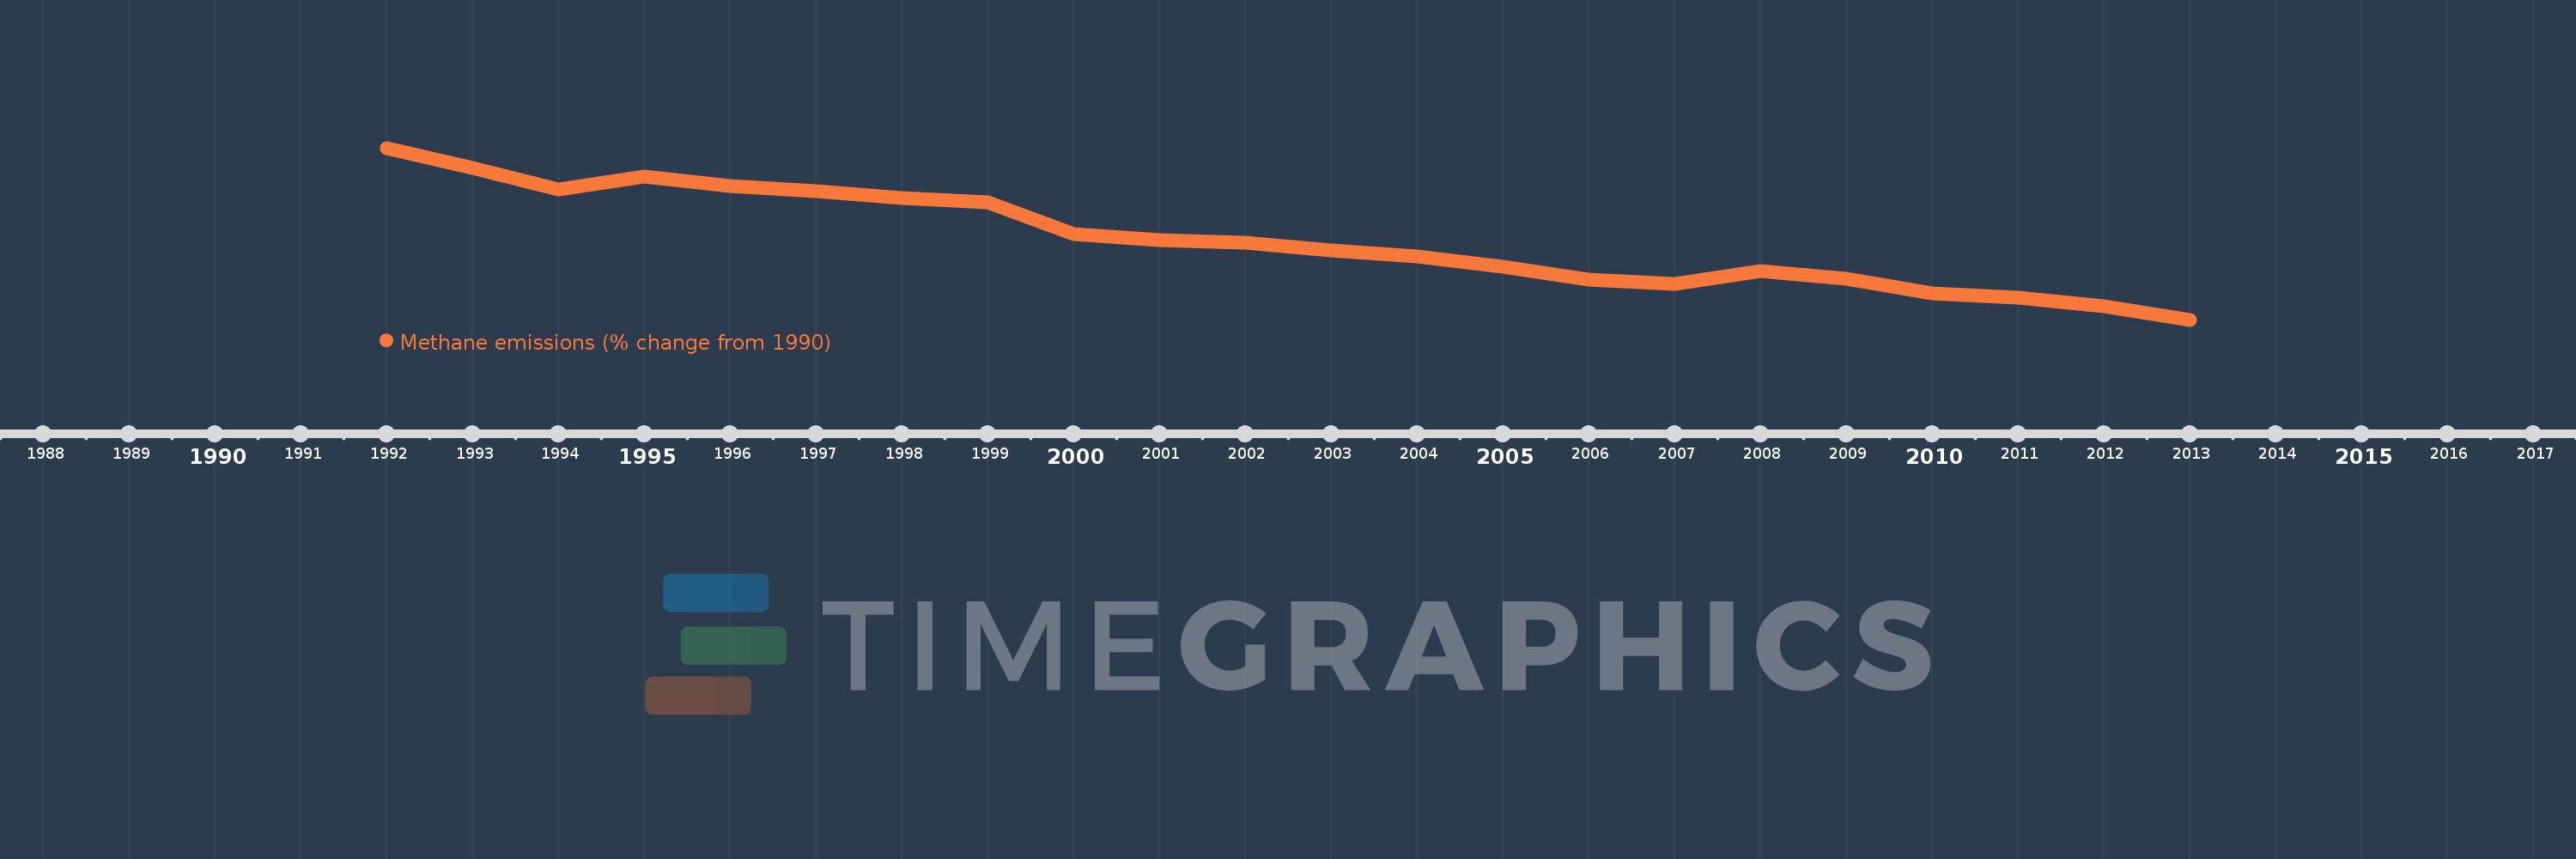
This timeline shows a graph from 1992 to 2013 of OECD members. No data until 1991. Number of actual observations by date: 22.
Source name:
World Development Indicators
Source organization:
World Bank staff estimates from original source: European Commission, Joint Research Centre (JRC)/Netherlands Environmental Assessment Agency (PBL). Emission Database for Global Atmospheric Research (EDGAR): http://edgar.jrc.ec.europa.eu/.
Categories, topics:
Climate Change, Environment
Last updated:
apr 23, 2017
Indicators value changes by year
Meaning:
-8.193
Minimum:
-14.107
jan 1, 2013
Maximum:
-1.368
jan 1, 1992
At the date of observation
Value
Absolute change
Change from the previous value
jan 1, 1992
-1.368
-1.368
0.0%
jan 1, 1993
-2.86
-1.492
109.04%
jan 1, 1994
-4.426
-1.566
54.78%
jan 1, 1995
-3.513
+0.913
-20.64%
jan 1, 1996
-4.216
-0.704
20.03%
jan 1, 1997
-4.579
-0.363
8.61%
jan 1, 1998
-5.102
-0.523
11.42%
jan 1, 1999
-5.419
-0.317
6.21%
jan 1, 2000
-7.765
-2.346
43.29%
jan 1, 2001
-8.19
-0.426
5.48%
jan 1, 2002
-8.385
-0.195
2.38%
jan 1, 2003
-8.948
-0.563
6.71%
jan 1, 2004
-9.415
-0.466
5.21%
jan 1, 2005
-10.147
-0.732
7.77%
jan 1, 2006
-11.13
-0.983
9.69%
jan 1, 2007
-11.425
-0.295
2.65%
jan 1, 2008
-10.469
+0.956
-8.37%
jan 1, 2009
-11.043
-0.574
5.48%
jan 1, 2010
-12.129
-1.086
9.84%
jan 1, 2011
-12.471
-0.342
2.82%
jan 1, 2012
-13.13
-0.659
5.29%
jan 1, 2013
-14.107
-0.977
7.44%
Ranking of countries by current statistics by years