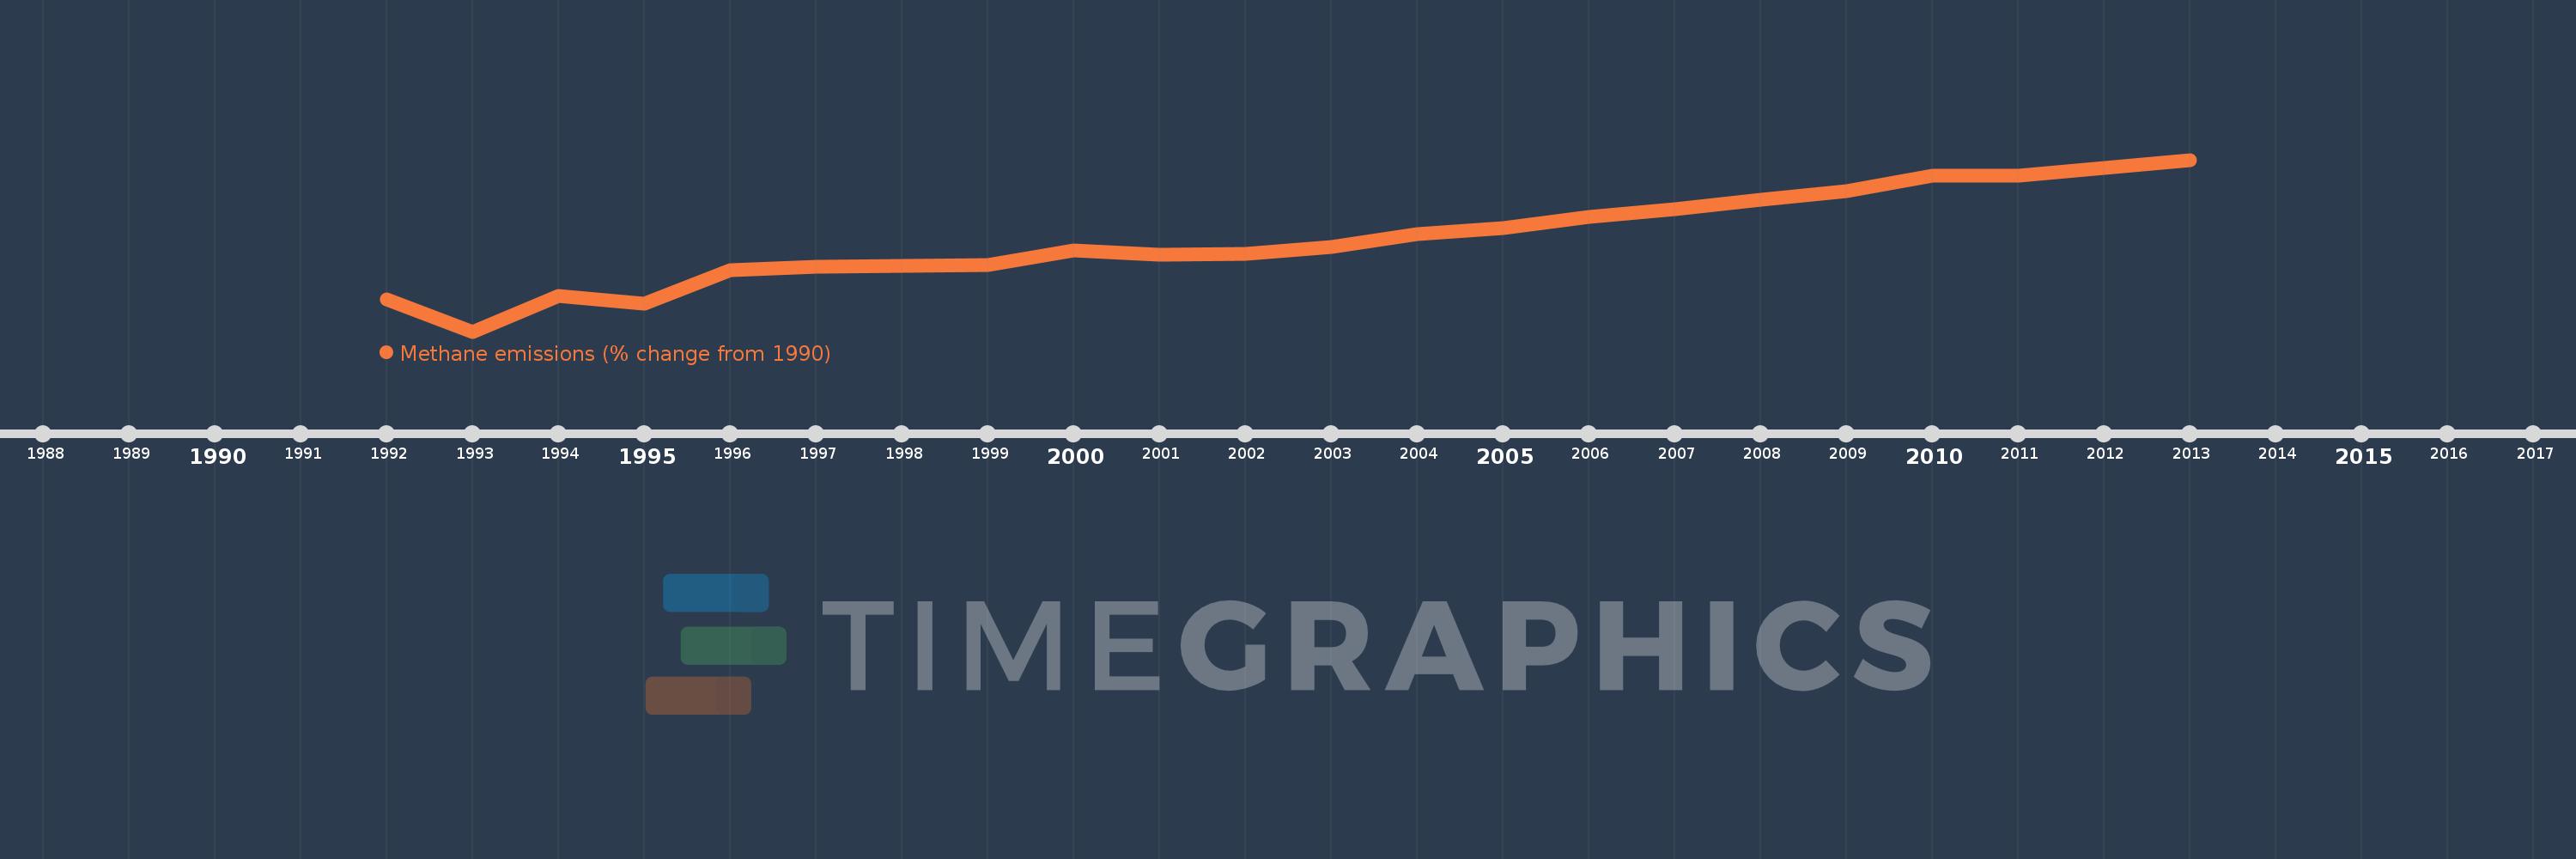
This timeline shows a graph from 1992 to 2013 of Nepal. No data until 1991. Number of actual observations by date: 22.
Source name:
World Development Indicators
Source organization:
World Bank staff estimates from original source: European Commission, Joint Research Centre (JRC)/Netherlands Environmental Assessment Agency (PBL). Emission Database for Global Atmospheric Research (EDGAR): http://edgar.jrc.ec.europa.eu/.
Categories, topics:
Climate Change, Environment
Last updated:
apr 23, 2017
Indicators value changes by year
Meaning:
6.77
Minimum:
-6.571
jan 1, 1993
Maximum:
18.222
jan 1, 2013
At the date of observation
Value
Absolute change
Change from the previous value
jan 1, 1992
-1.873
-1.873
0.0%
jan 1, 1993
-6.571
-4.698
250.86%
jan 1, 1994
-1.451
+5.12
-77.92%
jan 1, 1995
-2.525
-1.075
74.07%
jan 1, 1996
2.282
+4.808
-190.38%
jan 1, 1997
2.831
+0.548
24.02%
jan 1, 1998
2.972
+0.141
5.0%
jan 1, 1999
3.007
+0.035
1.18%
jan 1, 2000
5.141
+2.134
70.97%
jan 1, 2001
4.537
-0.604
-11.75%
jan 1, 2002
4.642
+0.105
2.31%
jan 1, 2003
5.652
+1.01
21.76%
jan 1, 2004
7.539
+1.887
33.38%
jan 1, 2005
8.34
+0.802
10.63%
jan 1, 2006
10.013
+1.673
20.05%
jan 1, 2007
11.149
+1.136
11.34%
jan 1, 2008
12.425
+1.276
11.44%
jan 1, 2009
13.695
+1.271
10.23%
jan 1, 2010
15.933
+2.238
16.34%
jan 1, 2011
15.904
-0.029
-0.18%
jan 1, 2012
17.063
+1.159
7.29%
jan 1, 2013
18.222
+1.159
6.79%
Ranking of countries by current statistics by years