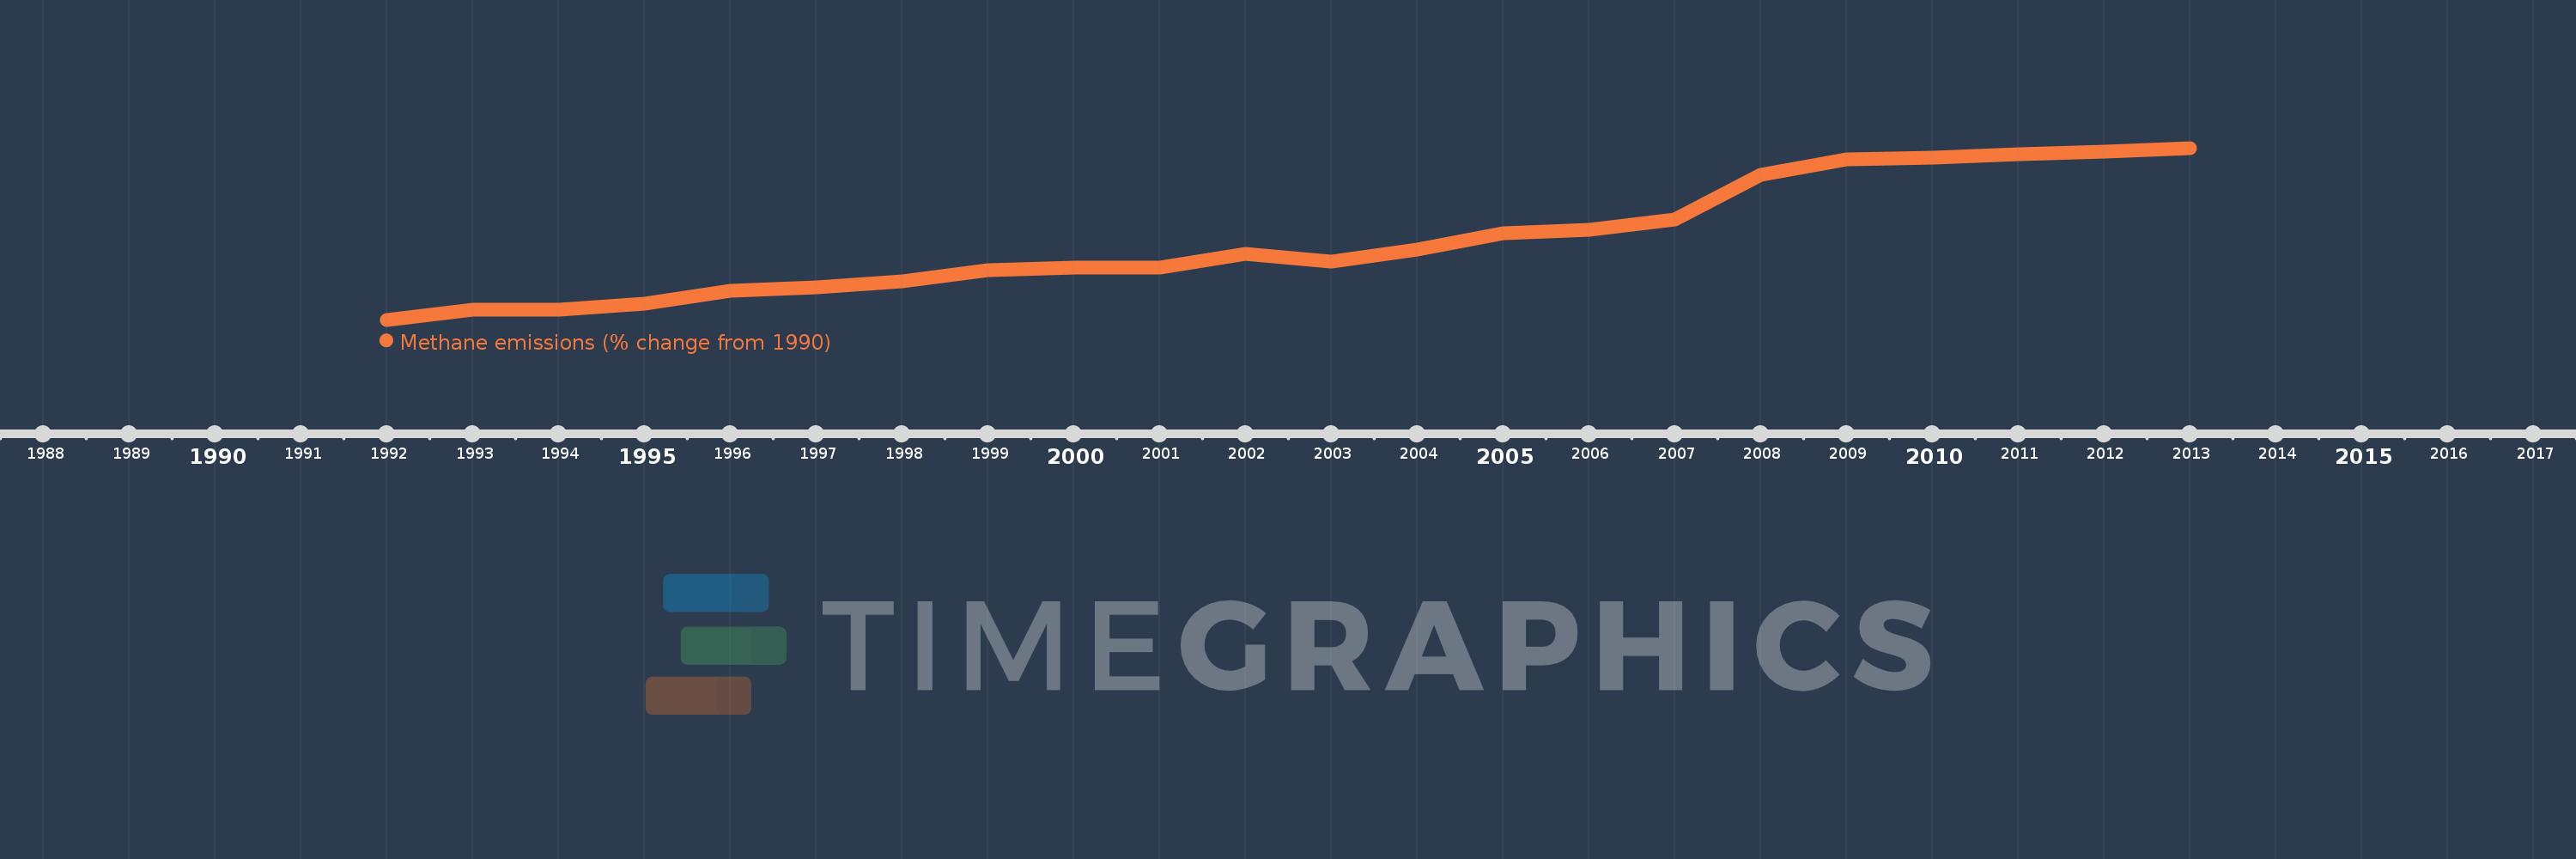
This timeline shows a graph from 1992 to 2013 of Mali. No data until 1991. Number of actual observations by date: 22.
Source name:
World Development Indicators
Source organization:
World Bank staff estimates from original source: European Commission, Joint Research Centre (JRC)/Netherlands Environmental Assessment Agency (PBL). Emission Database for Global Atmospheric Research (EDGAR): http://edgar.jrc.ec.europa.eu/.
Categories, topics:
Climate Change, Environment
Last updated:
apr 23, 2017
Indicators value changes by year
Meaning:
38.646
Minimum:
-5.836
jan 1, 1992
Maximum:
91.133
jan 1, 2013
At the date of observation
Value
Absolute change
Change from the previous value
jan 1, 1992
-5.836
-5.836
0.0%
jan 1, 1993
-0.316
+5.52
-94.58%
jan 1, 1994
-0.323
-0.006
2.04%
jan 1, 1995
3.226
+3.548
-1.1K%
jan 1, 1996
10.458
+7.232
224.19%
jan 1, 1997
12.53
+2.072
19.82%
jan 1, 1998
15.914
+3.384
27.01%
jan 1, 1999
22.318
+6.404
40.24%
jan 1, 2000
23.441
+1.123
5.03%
jan 1, 2001
23.805
+0.364
1.55%
jan 1, 2002
31.528
+7.723
32.44%
jan 1, 2003
27.185
-4.344
-13.78%
jan 1, 2004
33.63
+6.445
23.71%
jan 1, 2005
42.902
+9.272
27.57%
jan 1, 2006
44.985
+2.083
4.85%
jan 1, 2007
50.799
+5.814
12.92%
jan 1, 2008
75.835
+25.036
49.28%
jan 1, 2009
84.738
+8.903
11.74%
jan 1, 2010
85.626
+0.888
1.05%
jan 1, 2011
87.385
+1.76
2.06%
jan 1, 2012
89.259
+1.874
2.14%
jan 1, 2013
91.133
+1.874
2.1%
Ranking of countries by current statistics by years