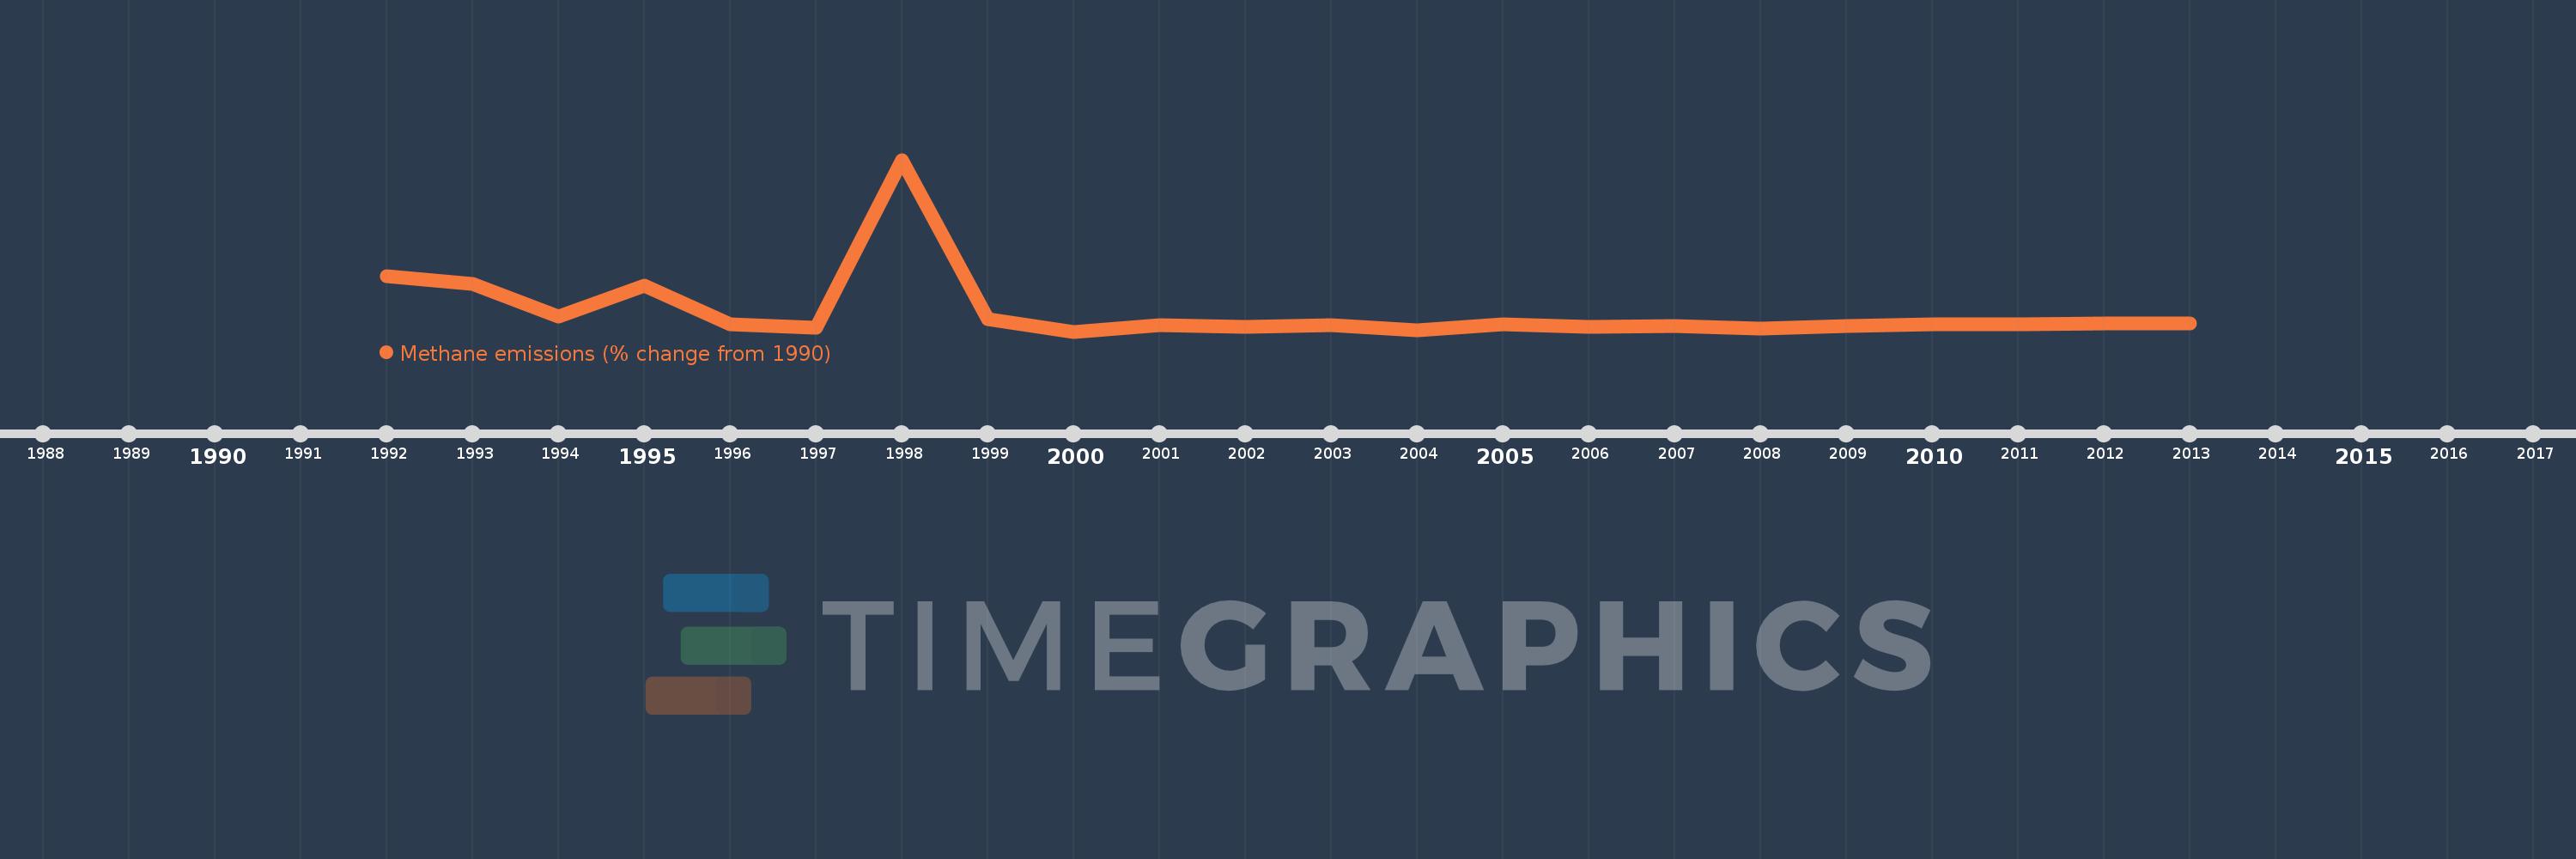
This timeline shows a graph from 1992 to 2013 of Papua New Guinea. No data until 1991. Number of actual observations by date: 22.
Source name:
World Development Indicators
Source organization:
World Bank staff estimates from original source: European Commission, Joint Research Centre (JRC)/Netherlands Environmental Assessment Agency (PBL). Emission Database for Global Atmospheric Research (EDGAR): http://edgar.jrc.ec.europa.eu/.
Categories, topics:
Climate Change, Environment
Last updated:
apr 23, 2017
Indicators value changes by year
Meaning:
22.49
Minimum:
-35.073
jan 1, 2000
Maximum:
463.521
jan 1, 1998
At the date of observation
Value
Absolute change
Change from the previous value
jan 1, 1992
126.117
+126.117
0.0%
jan 1, 1993
102.349
-23.768
-18.85%
jan 1, 1994
7.425
-94.925
-92.75%
jan 1, 1995
97.738
+90.313
1.22K%
jan 1, 1996
-12.763
-110.5
-113.06%
jan 1, 1997
-24.119
-11.356
88.98%
jan 1, 1998
463.521
+487.64
-2.02K%
jan 1, 1999
2.298
-461.223
-99.5%
jan 1, 2000
-35.073
-37.371
-1.63K%
jan 1, 2001
-17.468
+17.605
-50.2%
jan 1, 2002
-21.992
-4.524
25.9%
jan 1, 2003
-15.985
+6.006
-27.31%
jan 1, 2004
-30.723
-14.738
92.19%
jan 1, 2005
-13.098
+17.625
-57.37%
jan 1, 2006
-21.066
-7.968
60.84%
jan 1, 2007
-19.284
+1.782
-8.46%
jan 1, 2008
-25.144
-5.86
30.39%
jan 1, 2009
-17.76
+7.383
-29.36%
jan 1, 2010
-12.767
+4.993
-28.11%
jan 1, 2011
-13.346
-0.578
4.53%
jan 1, 2012
-12.479
+0.867
-6.49%
jan 1, 2013
-11.612
+0.867
-6.94%
Ranking of countries by current statistics by years