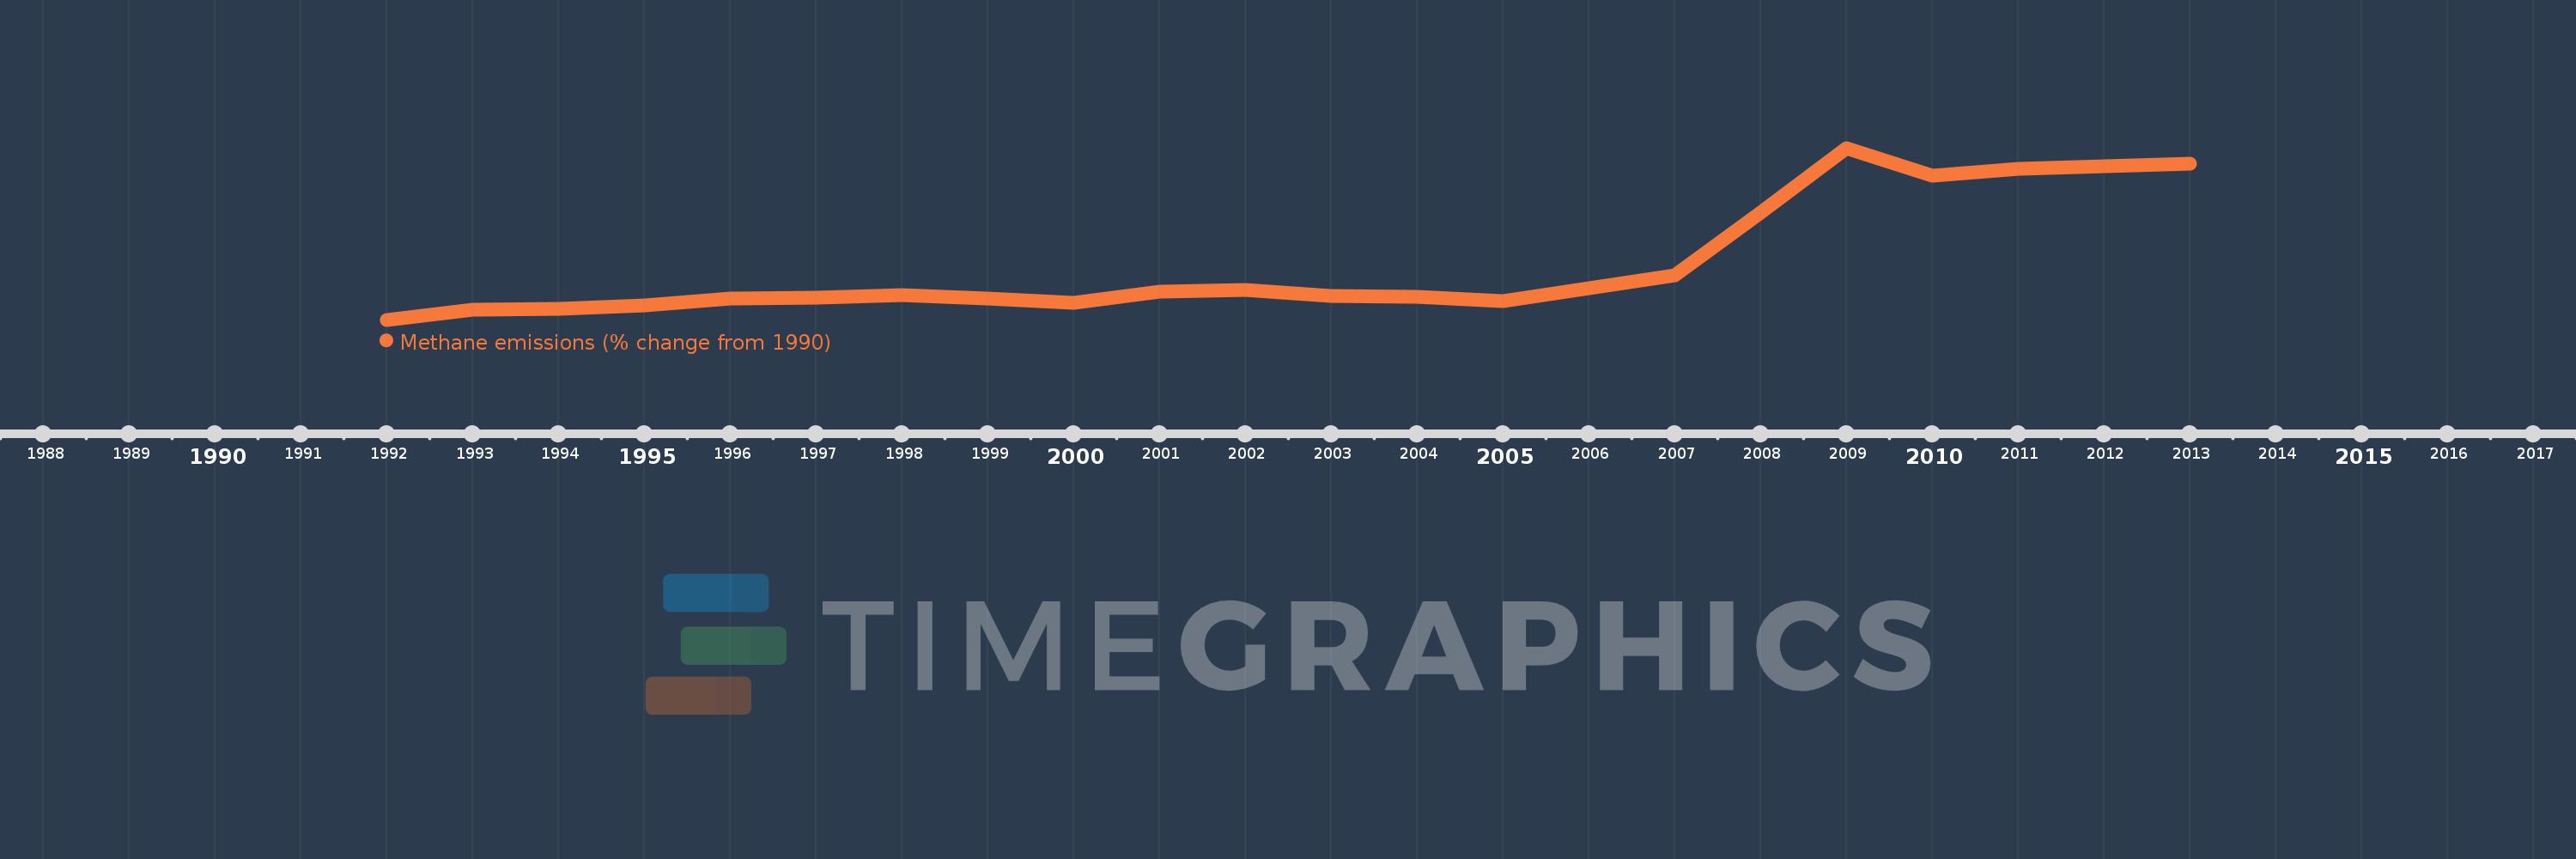
This timeline shows a graph from 1992 to 2013 of Ghana. No data until 1991. Number of actual observations by date: 22.
Source name:
World Development Indicators
Source organization:
World Bank staff estimates from original source: European Commission, Joint Research Centre (JRC)/Netherlands Environmental Assessment Agency (PBL). Emission Database for Global Atmospheric Research (EDGAR): http://edgar.jrc.ec.europa.eu/.
Categories, topics:
Climate Change, Environment
Last updated:
apr 23, 2017
Indicators value changes by year
Meaning:
52.651
Minimum:
-10.221
jan 1, 1992
Maximum:
183.89
jan 1, 2009
At the date of observation
Value
Absolute change
Change from the previous value
jan 1, 1992
-10.221
-10.221
0.0%
jan 1, 1993
1.586
+11.807
-115.52%
jan 1, 1994
2.035
+0.449
28.33%
jan 1, 1995
5.762
+3.727
183.12%
jan 1, 1996
13.357
+7.595
131.8%
jan 1, 1997
14.623
+1.267
9.48%
jan 1, 1998
17.691
+3.067
20.98%
jan 1, 1999
14.093
-3.598
-20.34%
jan 1, 2000
9.219
-4.874
-34.58%
jan 1, 2001
21.492
+12.273
133.13%
jan 1, 2002
23.018
+1.526
7.1%
jan 1, 2003
16.636
-6.382
-27.73%
jan 1, 2004
15.337
-1.299
-7.81%
jan 1, 2005
10.869
-4.467
-29.13%
jan 1, 2006
25.876
+15.007
138.07%
jan 1, 2007
39.677
+13.801
53.33%
jan 1, 2008
110.431
+70.755
178.33%
jan 1, 2009
183.89
+73.459
66.52%
jan 1, 2010
152.842
-31.048
-16.88%
jan 1, 2011
160.76
+7.918
5.18%
jan 1, 2012
163.368
+2.608
1.62%
jan 1, 2013
165.975
+2.608
1.6%
Ranking of countries by current statistics by years