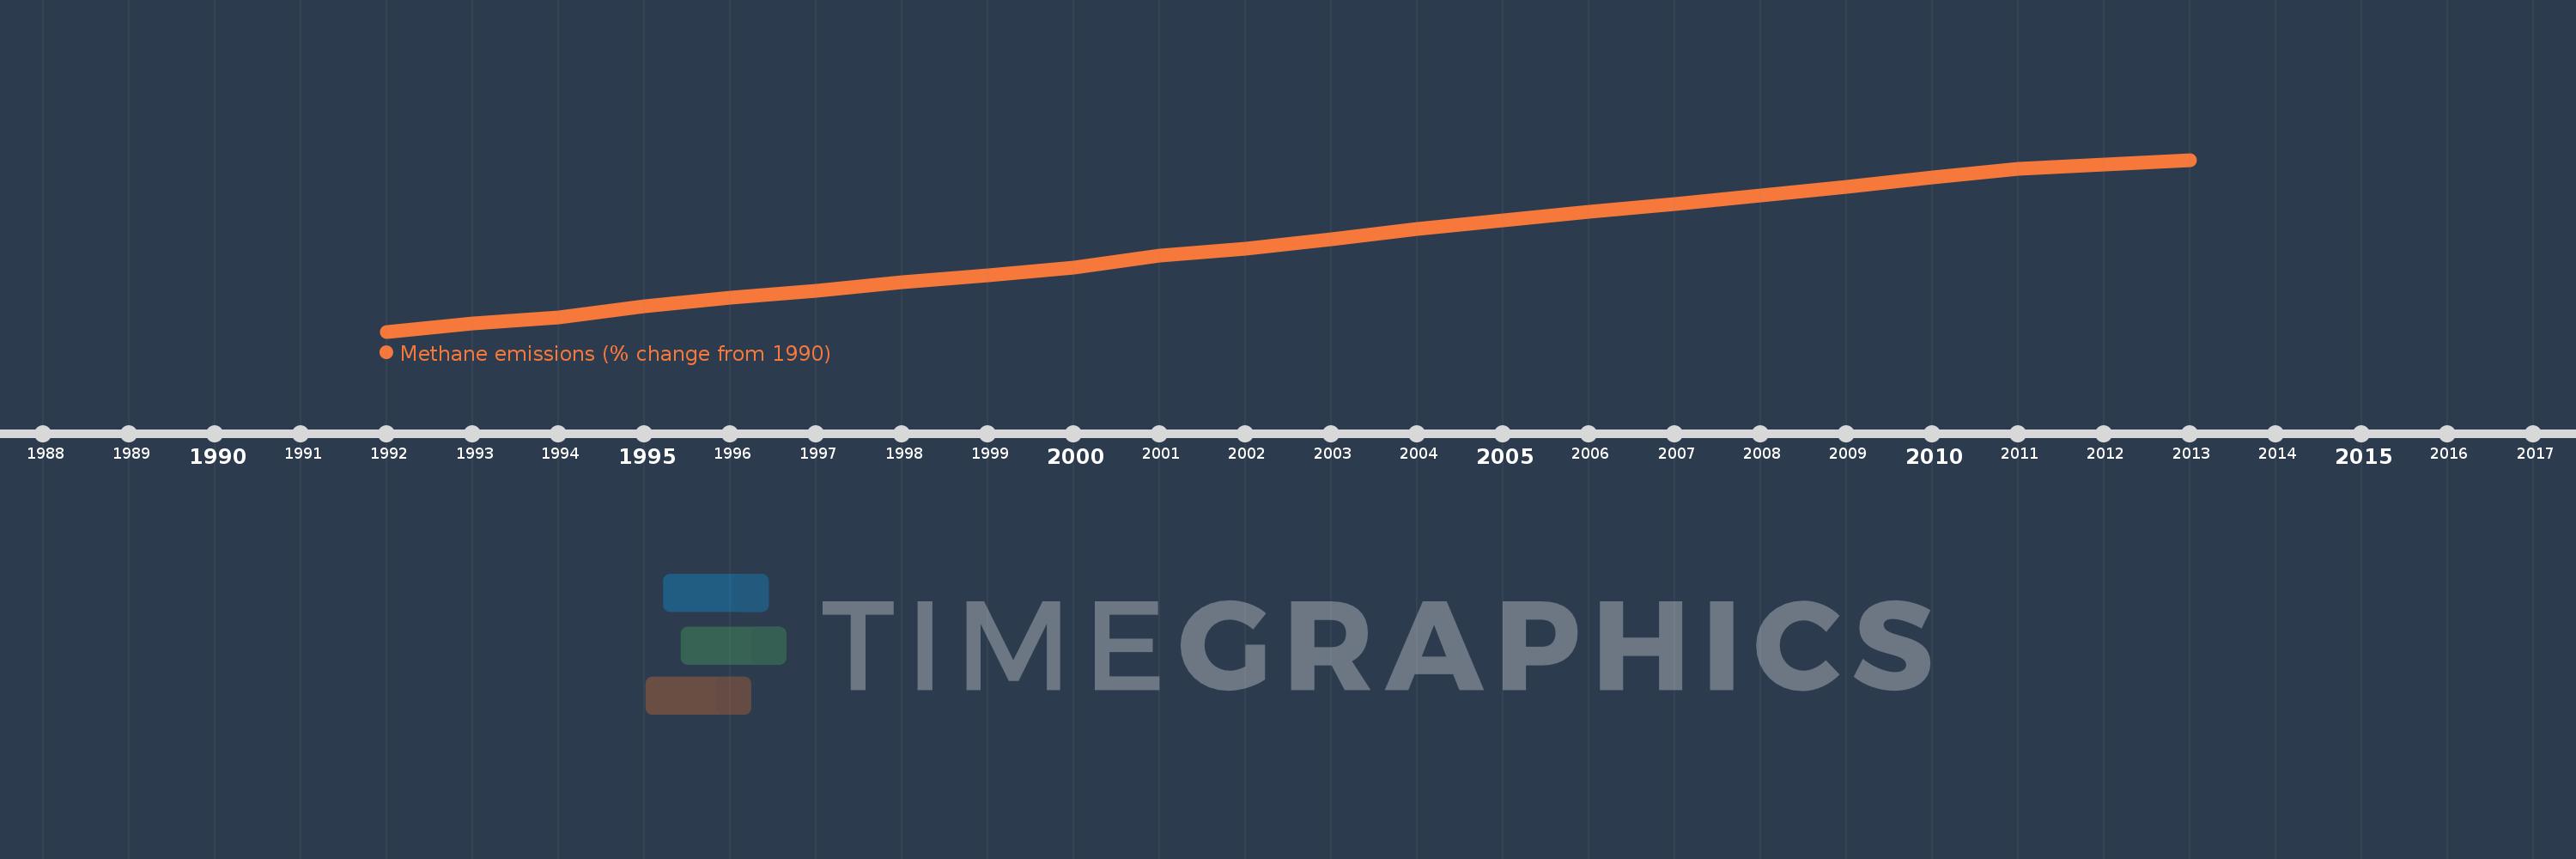
This timeline shows a graph from 1992 to 2013 of Sao Tome and Principe. No data until 1991. Number of actual observations by date: 22.
Source name:
World Development Indicators
Source organization:
World Bank staff estimates from original source: European Commission, Joint Research Centre (JRC)/Netherlands Environmental Assessment Agency (PBL). Emission Database for Global Atmospheric Research (EDGAR): http://edgar.jrc.ec.europa.eu/.
Categories, topics:
Climate Change, Environment
Last updated:
apr 23, 2017
Indicators value changes by year
Meaning:
32.556
Minimum:
2.968
jan 1, 1992
Maximum:
60.559
jan 1, 2013
At the date of observation
Value
Absolute change
Change from the previous value
jan 1, 1992
2.968
+2.968
0.0%
jan 1, 1993
5.805
+2.837
95.57%
jan 1, 1994
7.79
+1.985
34.19%
jan 1, 1995
11.574
+3.784
48.57%
jan 1, 1996
14.271
+2.697
23.3%
jan 1, 1997
16.746
+2.475
17.35%
jan 1, 1998
19.545
+2.799
16.71%
jan 1, 1999
21.74
+2.194
11.23%
jan 1, 2000
24.468
+2.728
12.55%
jan 1, 2001
28.439
+3.971
16.23%
jan 1, 2002
30.74
+2.301
8.09%
jan 1, 2003
33.952
+3.212
10.45%
jan 1, 2004
37.434
+3.482
10.26%
jan 1, 2005
40.289
+2.855
7.63%
jan 1, 2006
43.212
+2.922
7.25%
jan 1, 2007
45.723
+2.512
5.81%
jan 1, 2008
48.572
+2.849
6.23%
jan 1, 2009
51.428
+2.856
5.88%
jan 1, 2010
54.583
+3.155
6.13%
jan 1, 2011
57.41
+2.828
5.18%
jan 1, 2012
58.985
+1.574
2.74%
jan 1, 2013
60.559
+1.574
2.67%
Ranking of countries by current statistics by years