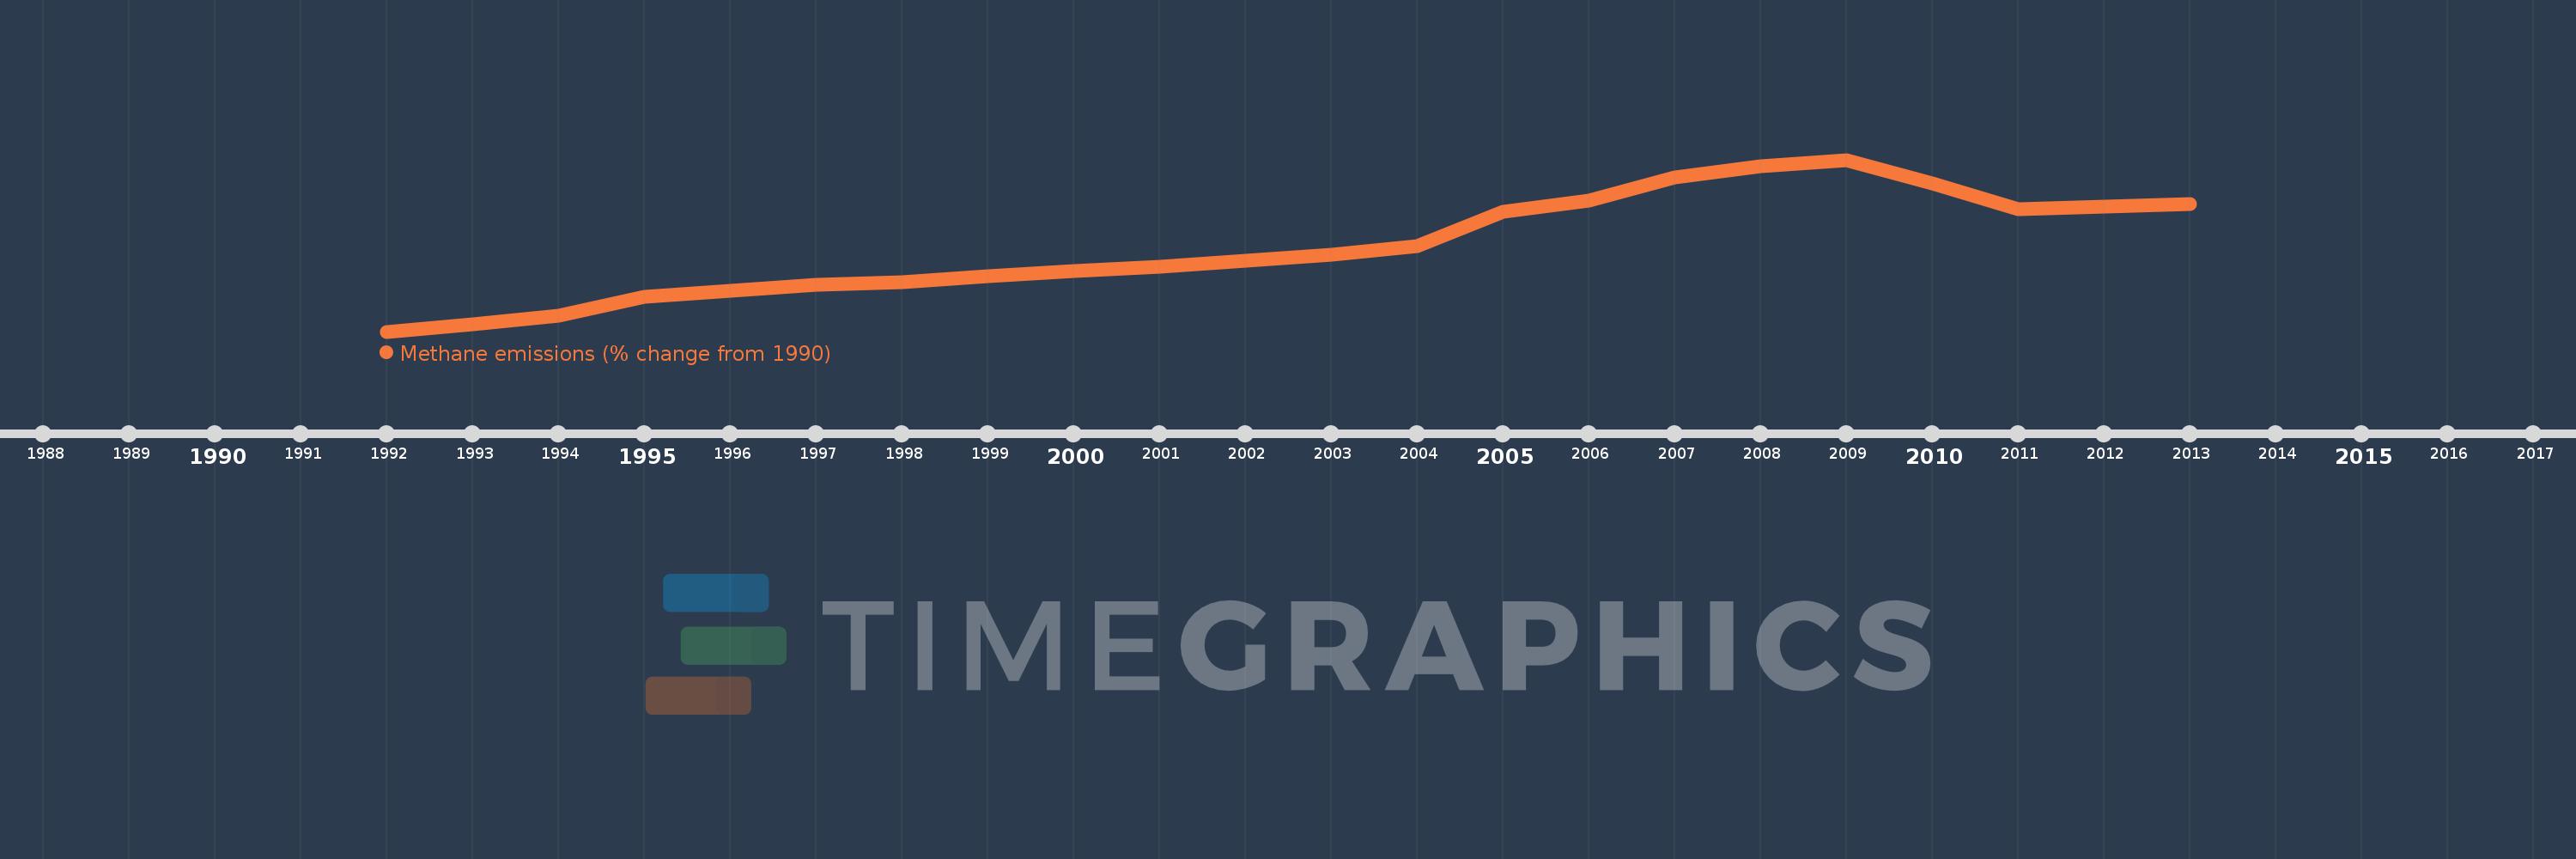
This timeline shows a graph from 1992 to 2013 of Israel. No data until 1991. Number of actual observations by date: 22.
Source name:
World Development Indicators
Source organization:
World Bank staff estimates from original source: European Commission, Joint Research Centre (JRC)/Netherlands Environmental Assessment Agency (PBL). Emission Database for Global Atmospheric Research (EDGAR): http://edgar.jrc.ec.europa.eu/.
Categories, topics:
Climate Change, Environment
Last updated:
apr 23, 2017
Indicators value changes by year
Meaning:
53.233
Minimum:
2.091
jan 1, 1992
Maximum:
105.09
jan 1, 2009
At the date of observation
Value
Absolute change
Change from the previous value
jan 1, 1992
2.091
+2.091
0.0%
jan 1, 1993
6.65
+4.559
217.97%
jan 1, 1994
11.598
+4.948
74.4%
jan 1, 1995
22.887
+11.289
97.34%
jan 1, 1996
26.61
+3.723
16.27%
jan 1, 1997
30.029
+3.419
12.85%
jan 1, 1998
31.902
+1.873
6.24%
jan 1, 1999
35.518
+3.616
11.33%
jan 1, 2000
38.4
+2.881
8.11%
jan 1, 2001
41.111
+2.712
7.06%
jan 1, 2002
44.817
+3.706
9.01%
jan 1, 2003
48.231
+3.414
7.62%
jan 1, 2004
53.387
+5.156
10.69%
jan 1, 2005
74.17
+20.784
38.93%
jan 1, 2006
80.74
+6.569
8.86%
jan 1, 2007
94.544
+13.805
17.1%
jan 1, 2008
101.025
+6.481
6.85%
jan 1, 2009
105.09
+4.065
4.02%
jan 1, 2010
91.148
-13.942
-13.27%
jan 1, 2011
75.307
-15.841
-17.38%
jan 1, 2012
77.06
+1.753
2.33%
jan 1, 2013
78.813
+1.753
2.27%
Ranking of countries by current statistics by years