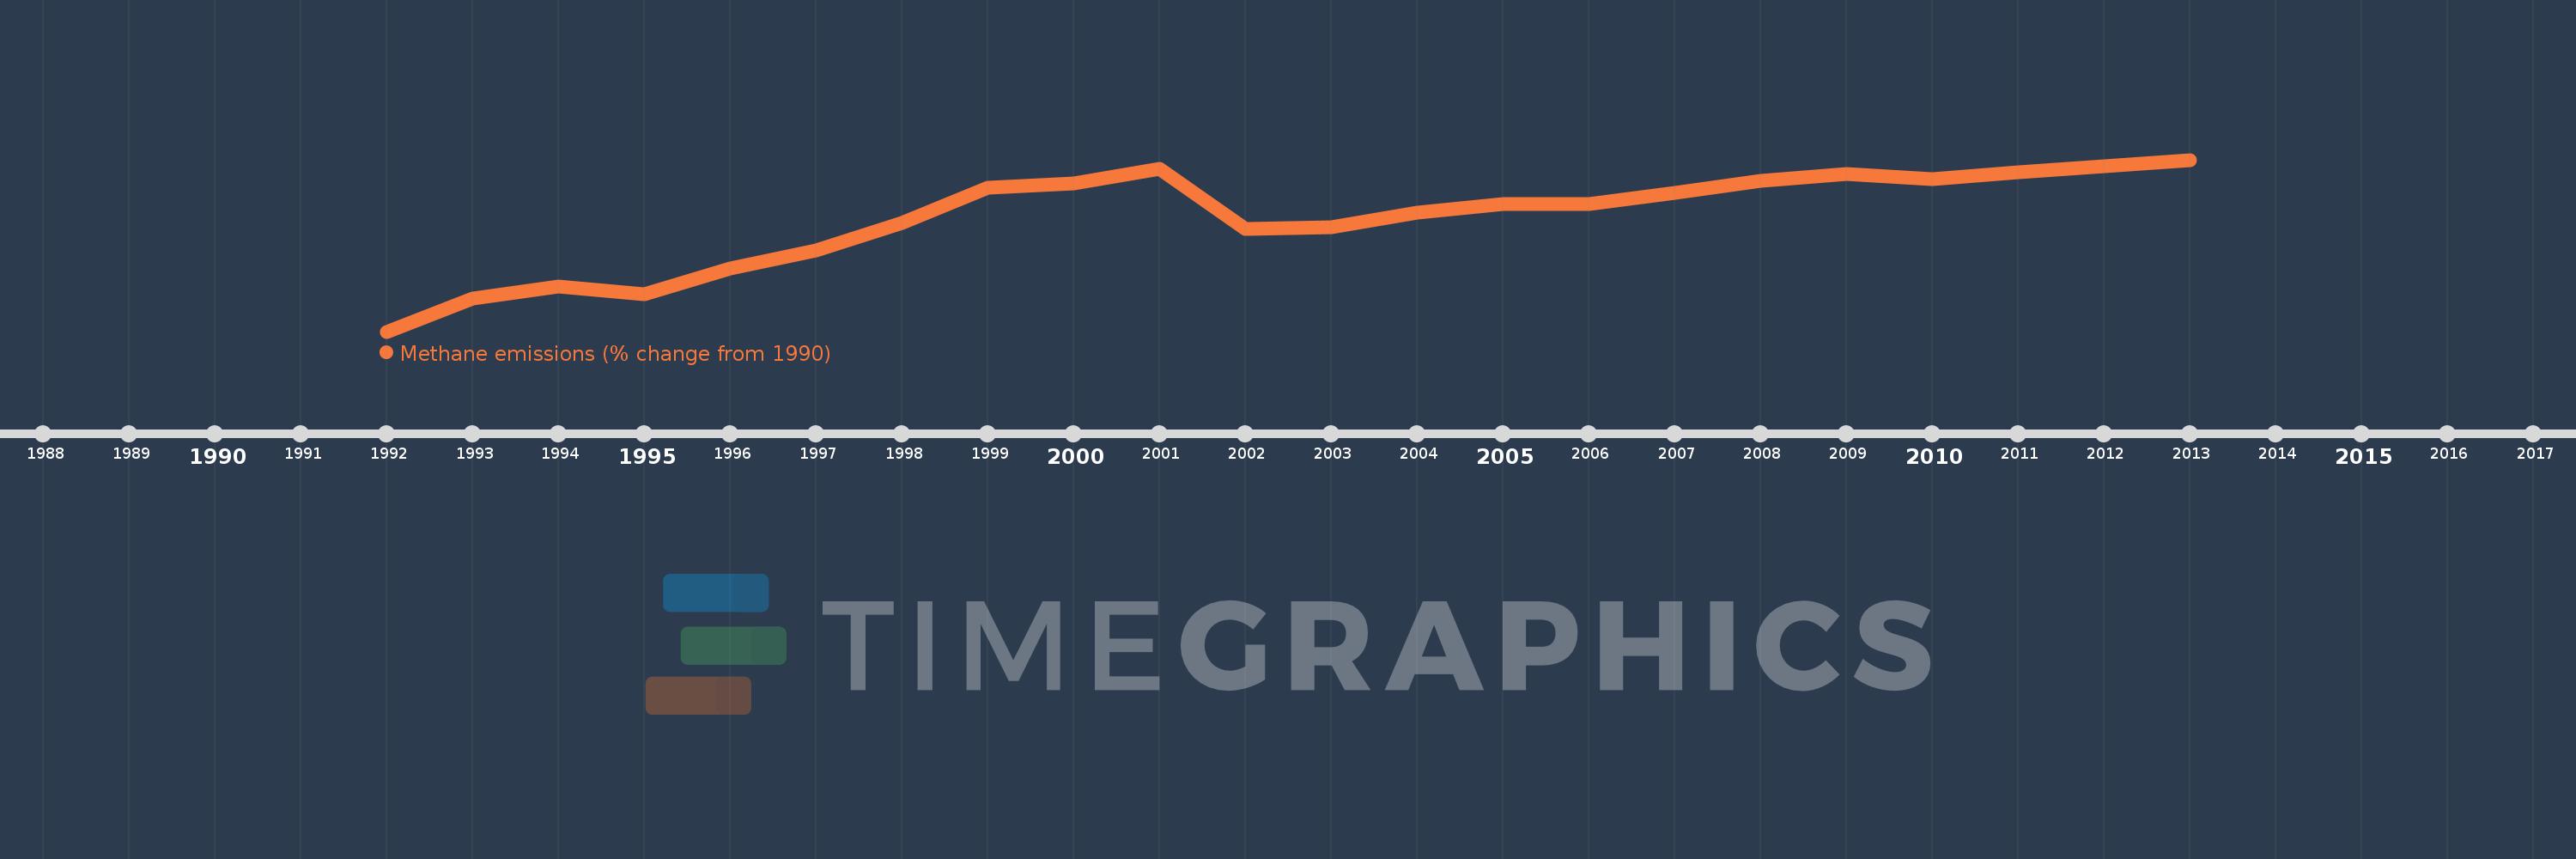
This timeline shows a graph from 1992 to 2013 of Syrian Arab Republic. No data until 1991. Number of actual observations by date: 22.
Source name:
World Development Indicators
Source organization:
World Bank staff estimates from original source: European Commission, Joint Research Centre (JRC)/Netherlands Environmental Assessment Agency (PBL). Emission Database for Global Atmospheric Research (EDGAR): http://edgar.jrc.ec.europa.eu/.
Categories, topics:
Climate Change, Environment
Last updated:
apr 23, 2017
Indicators value changes by year
Meaning:
38.657
Minimum:
11.639
jan 1, 1992
Maximum:
52.485
jan 1, 2013
At the date of observation
Value
Absolute change
Change from the previous value
jan 1, 1992
11.639
+11.639
0.0%
jan 1, 1993
19.518
+7.879
67.69%
jan 1, 1994
22.413
+2.895
14.83%
jan 1, 1995
20.538
-1.875
-8.37%
jan 1, 1996
26.601
+6.063
29.52%
jan 1, 1997
30.935
+4.334
16.29%
jan 1, 1998
37.515
+6.58
21.27%
jan 1, 1999
45.79
+8.275
22.06%
jan 1, 2000
46.817
+1.027
2.24%
jan 1, 2001
50.369
+3.551
7.59%
jan 1, 2002
36.012
-14.356
-28.5%
jan 1, 2003
36.405
+0.392
1.09%
jan 1, 2004
39.844
+3.439
9.45%
jan 1, 2005
42.053
+2.209
5.54%
jan 1, 2006
41.906
-0.147
-0.35%
jan 1, 2007
44.658
+2.752
6.57%
jan 1, 2008
47.392
+2.734
6.12%
jan 1, 2009
49.086
+1.694
3.57%
jan 1, 2010
47.979
-1.107
-2.26%
jan 1, 2011
49.495
+1.516
3.16%
jan 1, 2012
50.99
+1.495
3.02%
jan 1, 2013
52.485
+1.495
2.93%
Ranking of countries by current statistics by years