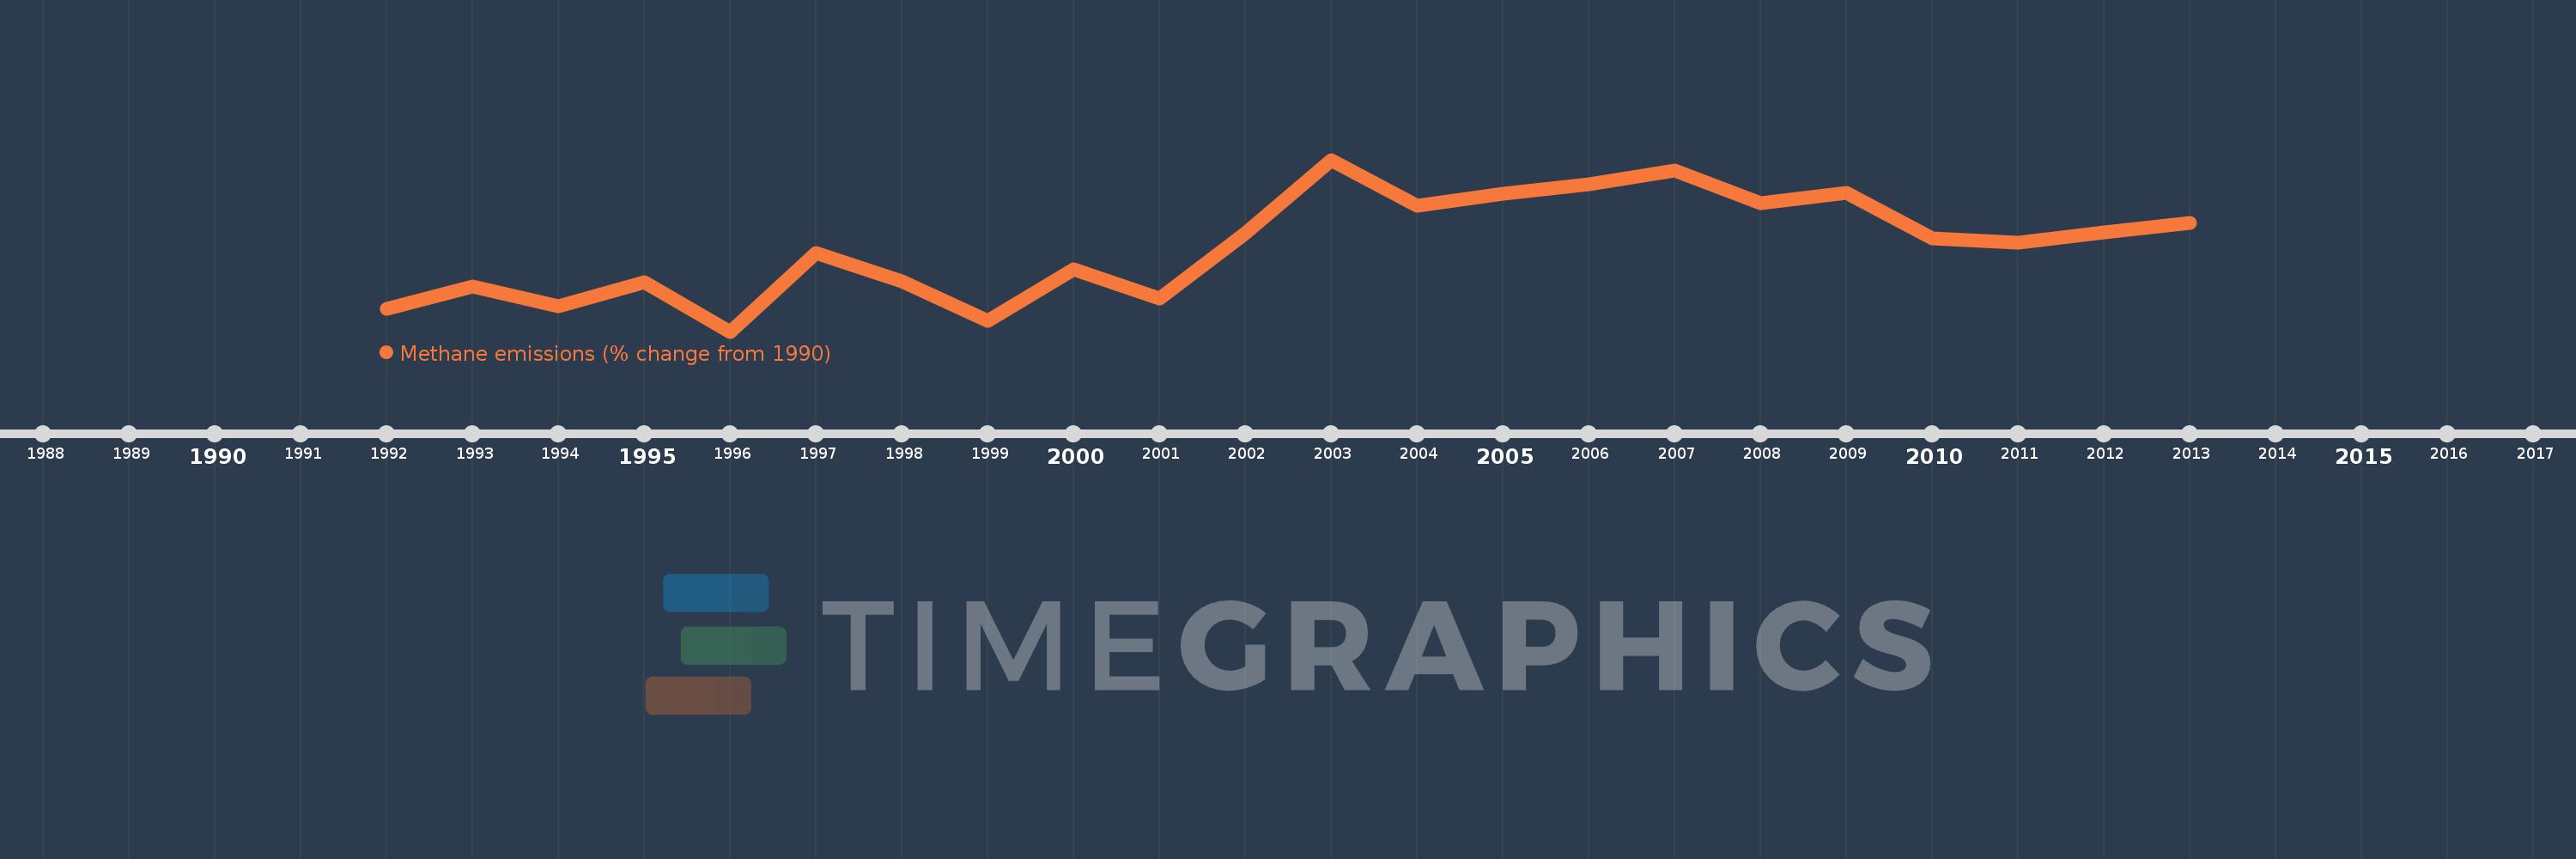
This timeline shows a graph from 1992 to 2013 of El Salvador. No data until 1991. Number of actual observations by date: 22.
Source name:
World Development Indicators
Source organization:
World Bank staff estimates from original source: European Commission, Joint Research Centre (JRC)/Netherlands Environmental Assessment Agency (PBL). Emission Database for Global Atmospheric Research (EDGAR): http://edgar.jrc.ec.europa.eu/.
Categories, topics:
Climate Change, Environment
Last updated:
apr 23, 2017
Indicators value changes by year
Meaning:
10.744
Minimum:
0.824
jan 1, 1996
Maximum:
20.805
jan 1, 2003
At the date of observation
Value
Absolute change
Change from the previous value
jan 1, 1992
3.489
+3.489
0.0%
jan 1, 1993
6.066
+2.577
73.85%
jan 1, 1994
3.729
-2.337
-38.52%
jan 1, 1995
6.617
+2.888
77.46%
jan 1, 1996
0.824
-5.793
-87.54%
jan 1, 1997
9.943
+9.118
1.11K%
jan 1, 1998
6.648
-3.294
-33.14%
jan 1, 1999
2.095
-4.553
-68.49%
jan 1, 2000
8.057
+5.962
284.55%
jan 1, 2001
4.659
-3.397
-42.17%
jan 1, 2002
12.309
+7.649
164.17%
jan 1, 2003
20.805
+8.497
69.03%
jan 1, 2004
15.424
-5.381
-25.86%
jan 1, 2005
16.9
+1.476
9.57%
jan 1, 2006
17.923
+1.023
6.05%
jan 1, 2007
19.525
+1.602
8.94%
jan 1, 2008
15.745
-3.78
-19.36%
jan 1, 2009
16.978
+1.233
7.83%
jan 1, 2010
11.646
-5.332
-31.41%
jan 1, 2011
11.213
-0.432
-3.71%
jan 1, 2012
12.326
+1.112
9.92%
jan 1, 2013
13.438
+1.112
9.02%
Ranking of countries by current statistics by years