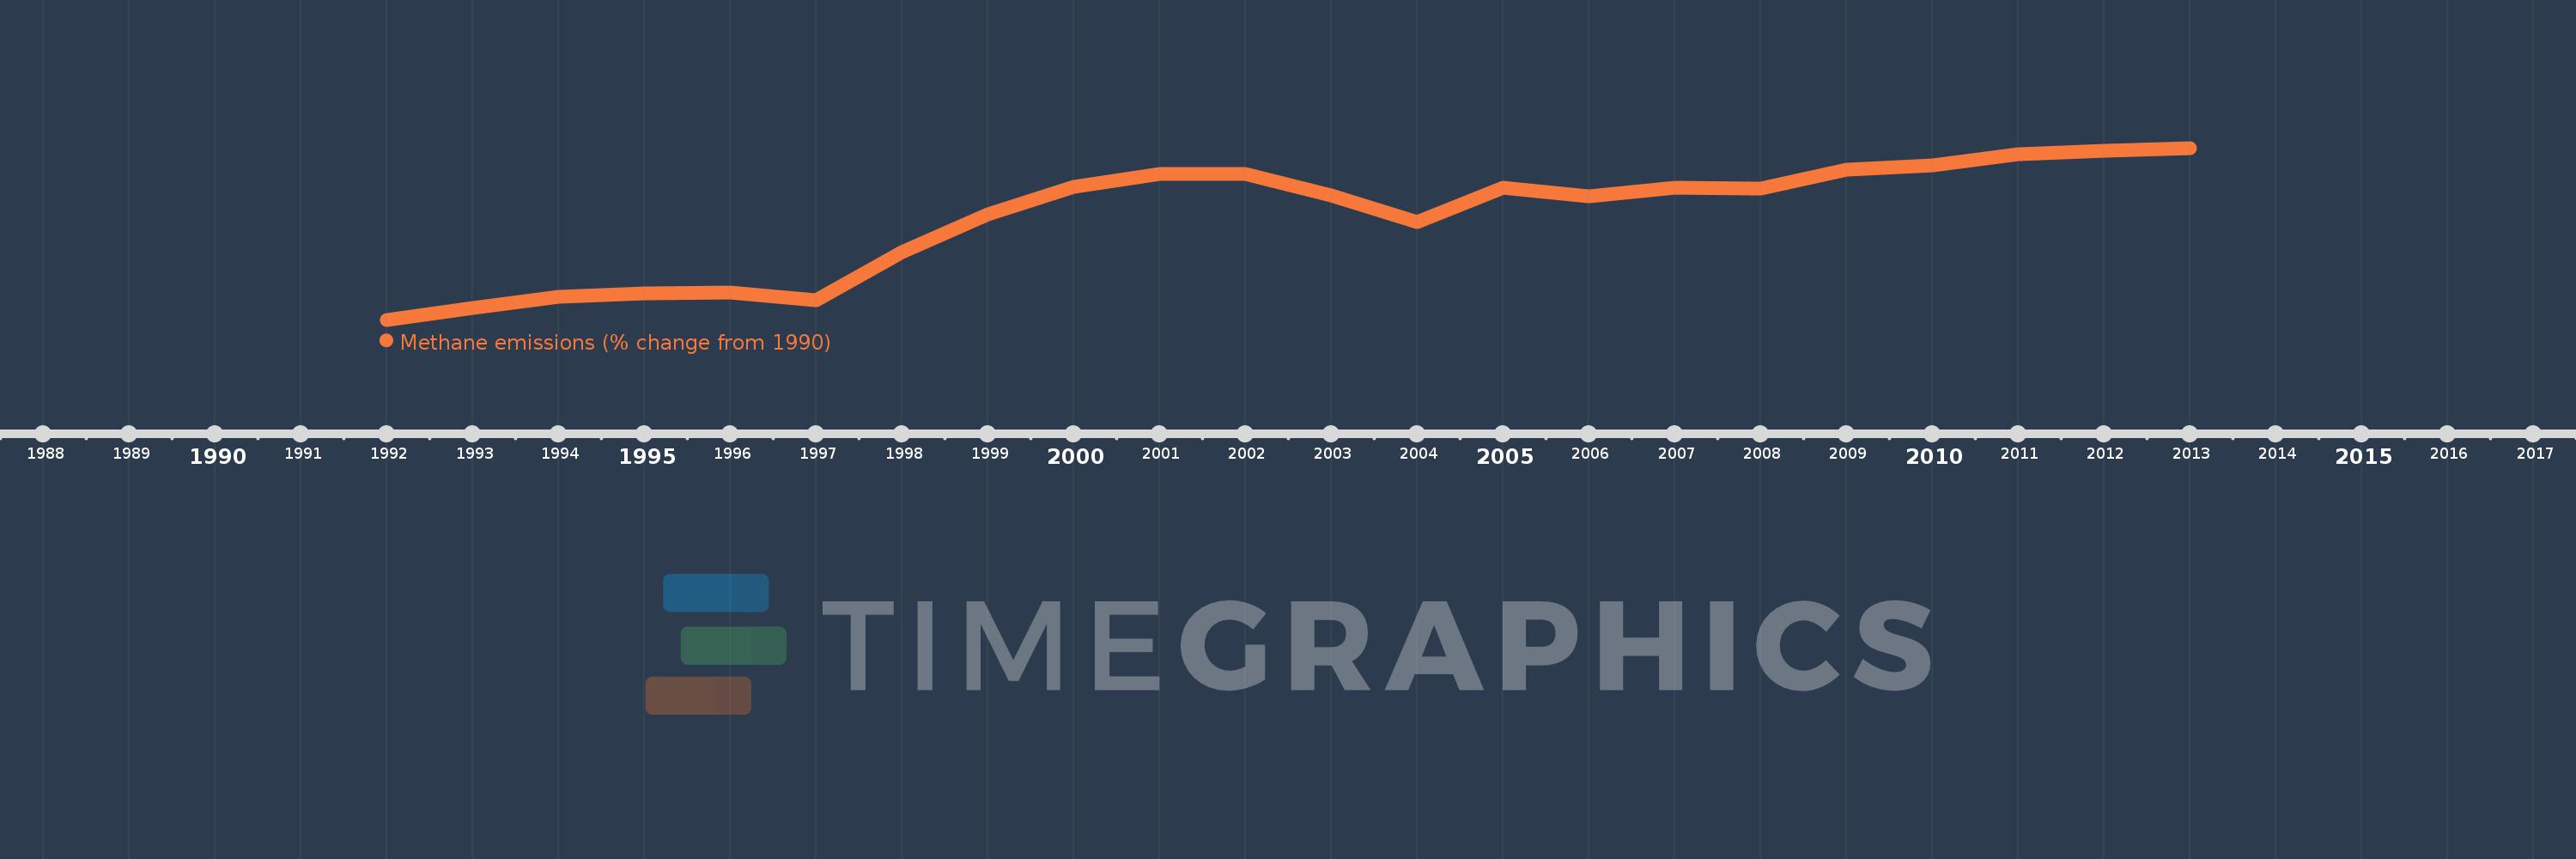
This timeline shows a graph from 1992 to 2013 of Iraq. No data until 1991. Number of actual observations by date: 22.
Source name:
World Development Indicators
Source organization:
World Bank staff estimates from original source: European Commission, Joint Research Centre (JRC)/Netherlands Environmental Assessment Agency (PBL). Emission Database for Global Atmospheric Research (EDGAR): http://edgar.jrc.ec.europa.eu/.
Categories, topics:
Climate Change, Environment
Last updated:
apr 23, 2017
Indicators value changes by year
Meaning:
-11.072
Minimum:
-47.769
jan 1, 1992
Maximum:
13.676
jan 1, 2013
At the date of observation
Value
Absolute change
Change from the previous value
jan 1, 1992
-47.769
-47.769
0.0%
jan 1, 1993
-43.427
+4.342
-9.09%
jan 1, 1994
-39.706
+3.721
-8.57%
jan 1, 1995
-38.189
+1.517
-3.82%
jan 1, 1996
-37.953
+0.235
-0.62%
jan 1, 1997
-40.891
-2.938
7.74%
jan 1, 1998
-23.471
+17.42
-42.6%
jan 1, 1999
-9.983
+13.488
-57.47%
jan 1, 2000
-0.209
+9.775
-97.91%
jan 1, 2001
4.233
+4.442
-2.13K%
jan 1, 2002
4.296
+0.063
1.48%
jan 1, 2003
-3.161
-7.457
-173.59%
jan 1, 2004
-12.747
-9.586
303.22%
jan 1, 2005
-0.648
+12.099
-94.91%
jan 1, 2006
-3.564
-2.916
449.68%
jan 1, 2007
-0.415
+3.15
-88.37%
jan 1, 2008
-0.832
-0.418
100.79%
jan 1, 2009
5.862
+6.694
-804.26%
jan 1, 2010
7.302
+1.441
24.58%
jan 1, 2011
11.447
+4.145
56.76%
jan 1, 2012
12.562
+1.114
9.74%
jan 1, 2013
13.676
+1.114
8.87%
Ranking of countries by current statistics by years