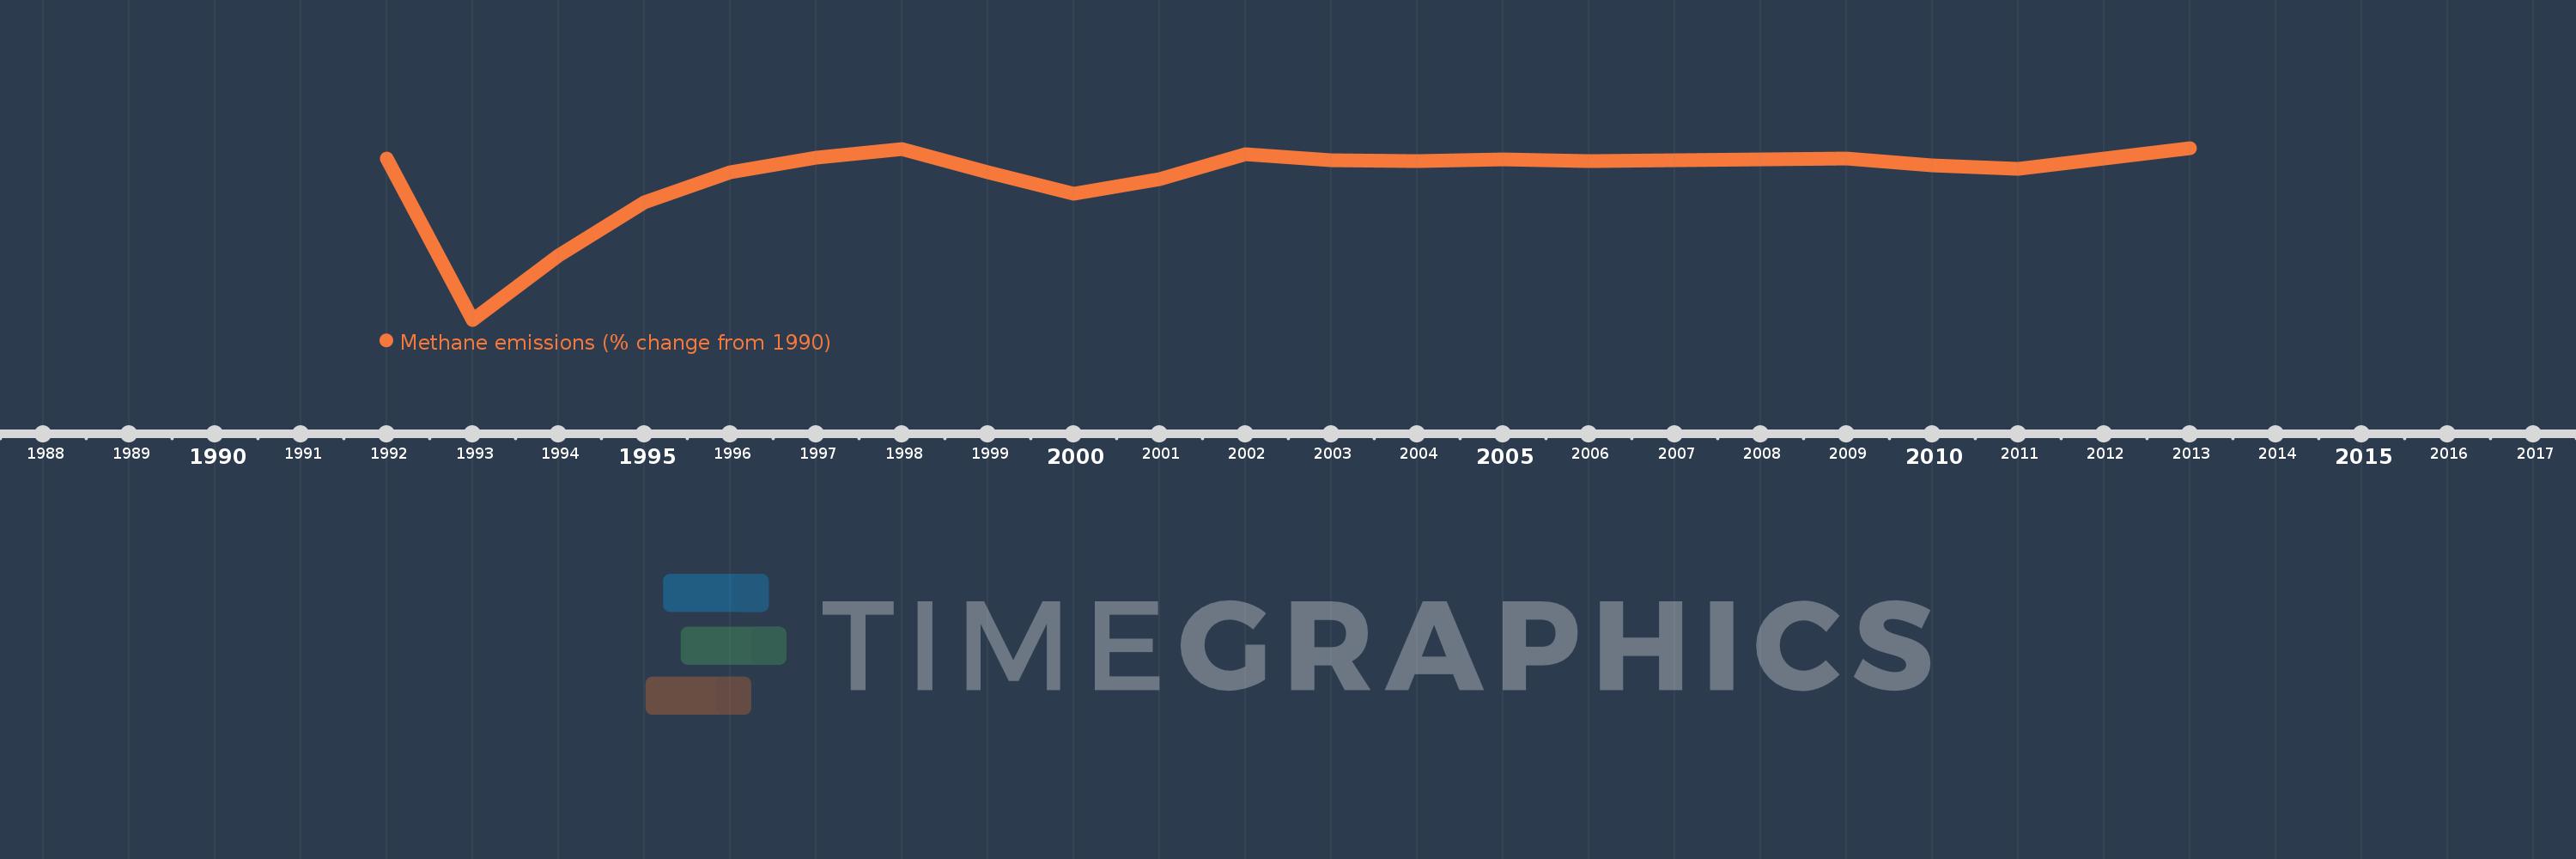
This timeline shows a graph from 1992 to 2013 of Pacific island small states. No data until 1991. Number of actual observations by date: 22.
Source name:
World Development Indicators
Source organization:
World Bank staff estimates from original source: European Commission, Joint Research Centre (JRC)/Netherlands Environmental Assessment Agency (PBL). Emission Database for Global Atmospheric Research (EDGAR): http://edgar.jrc.ec.europa.eu/.
Categories, topics:
Climate Change, Environment
Last updated:
apr 23, 2017
Indicators value changes by year
Meaning:
-16.298
Minimum:
-28.071
jan 1, 1993
Maximum:
-13.985
jan 1, 2013
At the date of observation
Value
Absolute change
Change from the previous value
jan 1, 1992
-14.867
-14.867
0.0%
jan 1, 1993
-28.071
-13.204
88.82%
jan 1, 1994
-22.815
+5.256
-18.72%
jan 1, 1995
-18.475
+4.34
-19.02%
jan 1, 1996
-15.962
+2.513
-13.6%
jan 1, 1997
-14.777
+1.185
-7.43%
jan 1, 1998
-14.09
+0.687
-4.65%
jan 1, 1999
-15.962
-1.872
13.28%
jan 1, 2000
-17.73
-1.769
11.08%
jan 1, 2001
-16.575
+1.155
-6.51%
jan 1, 2002
-14.521
+2.054
-12.39%
jan 1, 2003
-15.012
-0.491
3.38%
jan 1, 2004
-15.056
-0.044
0.29%
jan 1, 2005
-14.935
+0.121
-0.8%
jan 1, 2006
-15.071
-0.135
0.91%
jan 1, 2007
-14.975
+0.096
-0.63%
jan 1, 2008
-14.916
+0.059
-0.39%
jan 1, 2009
-14.836
+0.08
-0.54%
jan 1, 2010
-15.416
-0.58
3.91%
jan 1, 2011
-15.671
-0.256
1.66%
jan 1, 2012
-14.828
+0.843
-5.38%
jan 1, 2013
-13.985
+0.843
-5.69%
Ranking of countries by current statistics by years