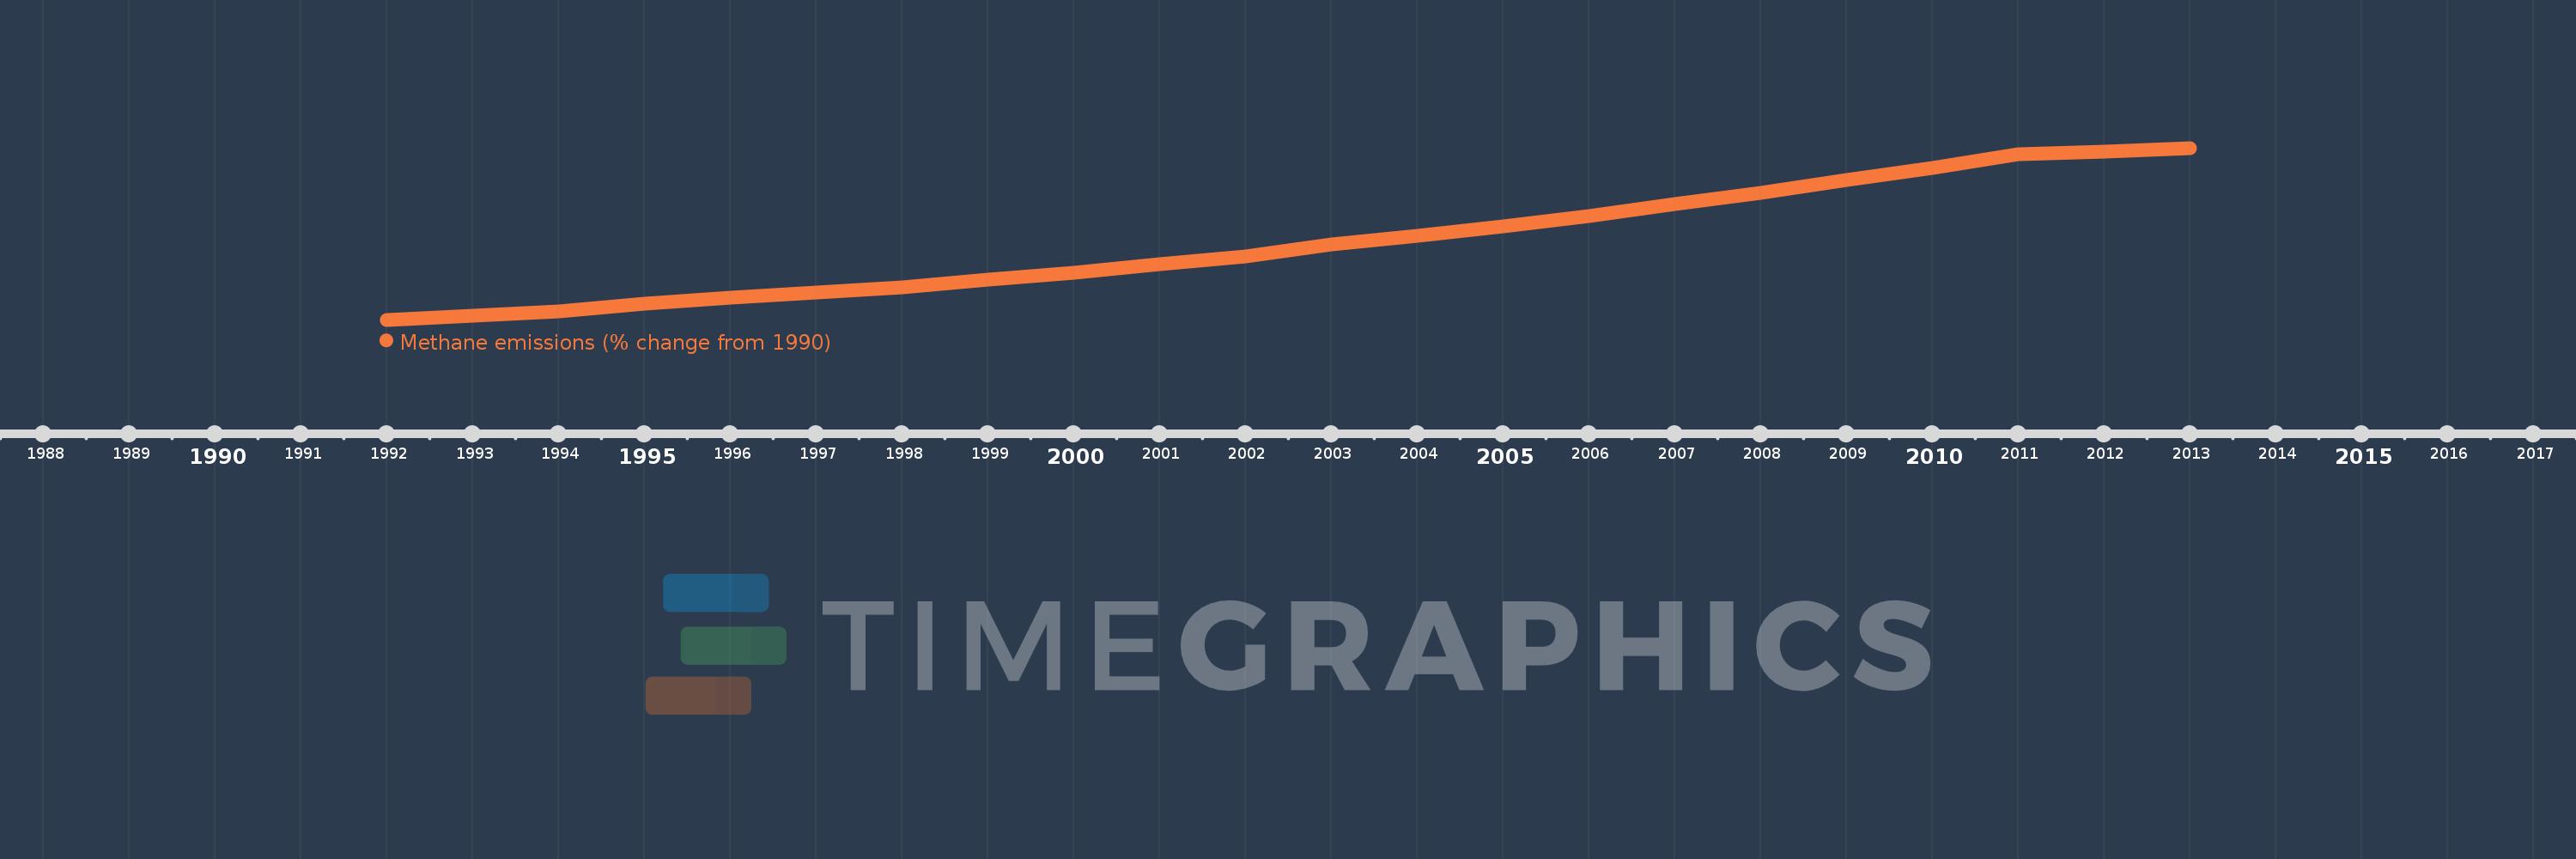
This timeline shows a graph from 1992 to 2013 of Maldives. No data until 1991. Number of actual observations by date: 22.
Source name:
World Development Indicators
Source organization:
World Bank staff estimates from original source: European Commission, Joint Research Centre (JRC)/Netherlands Environmental Assessment Agency (PBL). Emission Database for Global Atmospheric Research (EDGAR): http://edgar.jrc.ec.europa.eu/.
Categories, topics:
Climate Change, Environment
Last updated:
apr 23, 2017
Indicators value changes by year
Meaning:
51.484
Minimum:
2.689
jan 1, 1992
Maximum:
110.378
jan 1, 2013
At the date of observation
Value
Absolute change
Change from the previous value
jan 1, 1992
2.689
+2.689
0.0%
jan 1, 1993
5.3
+2.612
97.14%
jan 1, 1994
8.137
+2.837
53.52%
jan 1, 1995
12.539
+4.402
54.1%
jan 1, 1996
16.703
+4.164
33.21%
jan 1, 1997
19.874
+3.171
18.99%
jan 1, 1998
23.149
+3.275
16.48%
jan 1, 1999
27.608
+4.459
19.26%
jan 1, 2000
32.326
+4.718
17.09%
jan 1, 2001
37.612
+5.286
16.35%
jan 1, 2002
42.393
+4.781
12.71%
jan 1, 2003
49.828
+7.435
17.54%
jan 1, 2004
55.203
+5.375
10.79%
jan 1, 2005
61.176
+5.974
10.82%
jan 1, 2006
67.531
+6.355
10.39%
jan 1, 2007
75.167
+7.636
11.31%
jan 1, 2008
82.483
+7.316
9.73%
jan 1, 2009
90.086
+7.603
9.22%
jan 1, 2010
97.887
+7.8
8.66%
jan 1, 2011
106.253
+8.366
8.55%
jan 1, 2012
108.315
+2.063
1.94%
jan 1, 2013
110.378
+2.063
1.9%
Ranking of countries by current statistics by years