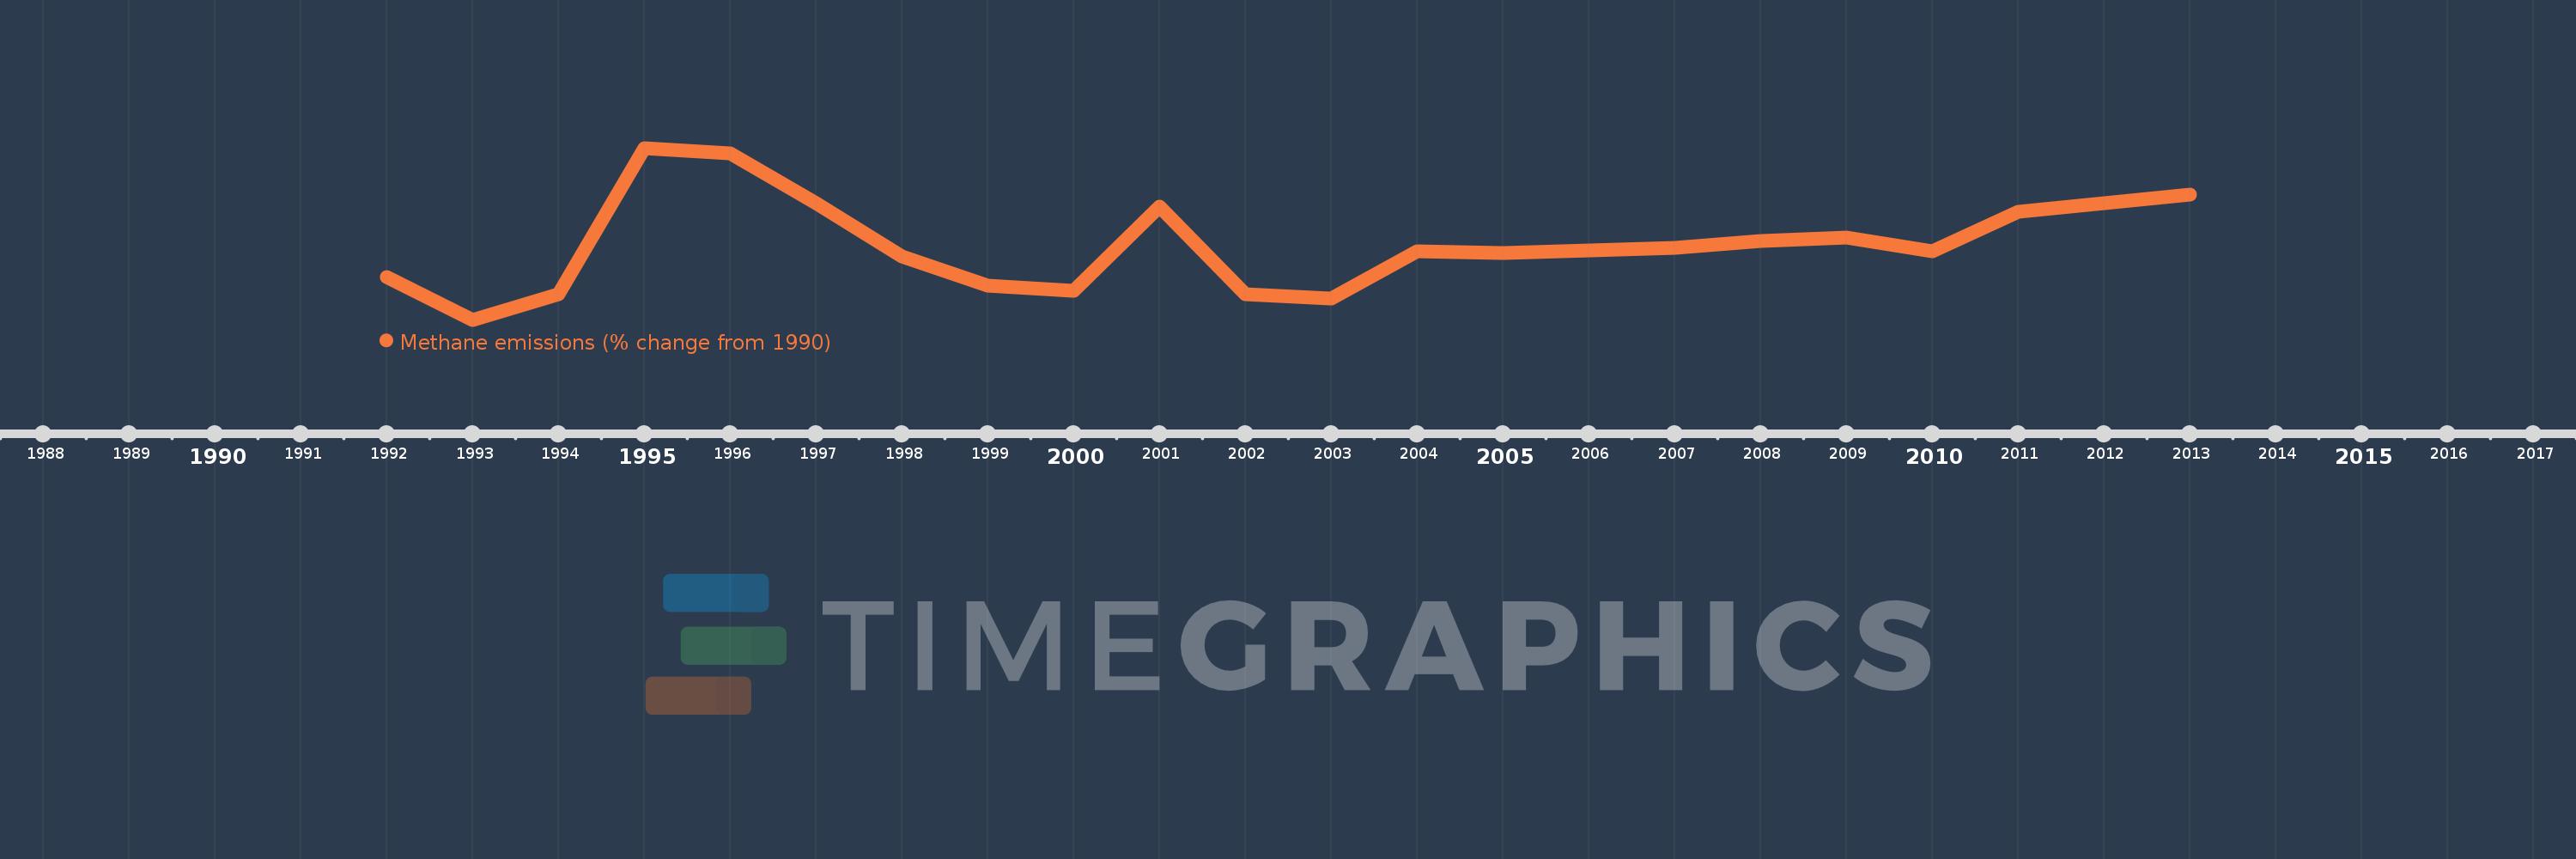
This timeline shows a graph from 1992 to 2013 of Albania. No data until 1991. Number of actual observations by date: 22.
Source name:
World Development Indicators
Source organization:
World Bank staff estimates from original source: European Commission, Joint Research Centre (JRC)/Netherlands Environmental Assessment Agency (PBL). Emission Database for Global Atmospheric Research (EDGAR): http://edgar.jrc.ec.europa.eu/.
Categories, topics:
Climate Change, Environment
Last updated:
apr 23, 2017
Indicators value changes by year
Meaning:
-1.997
Minimum:
-10.915
jan 1, 1993
Maximum:
9.305
jan 1, 1995
At the date of observation
Value
Absolute change
Change from the previous value
jan 1, 1992
-5.869
-5.869
0.0%
jan 1, 1993
-10.915
-5.046
85.98%
jan 1, 1994
-7.953
+2.962
-27.13%
jan 1, 1995
9.305
+17.258
-217.0%
jan 1, 1996
8.707
-0.598
-6.43%
jan 1, 1997
2.805
-5.902
-67.78%
jan 1, 1998
-3.475
-6.28
-223.86%
jan 1, 1999
-6.889
-3.415
98.27%
jan 1, 2000
-7.463
-0.574
8.33%
jan 1, 2001
2.428
+9.891
-132.53%
jan 1, 2002
-7.92
-10.348
-426.21%
jan 1, 2003
-8.392
-0.472
5.95%
jan 1, 2004
-2.896
+5.496
-65.49%
jan 1, 2005
-3.021
-0.124
4.3%
jan 1, 2006
-2.745
+0.276
-9.14%
jan 1, 2007
-2.422
+0.323
-11.77%
jan 1, 2008
-1.618
+0.803
-33.17%
jan 1, 2009
-1.191
+0.428
-26.42%
jan 1, 2010
-2.817
-1.627
136.6%
jan 1, 2011
1.783
+4.6
-163.28%
jan 1, 2012
2.801
+1.018
57.09%
jan 1, 2013
3.819
+1.018
36.34%
Ranking of countries by current statistics by years