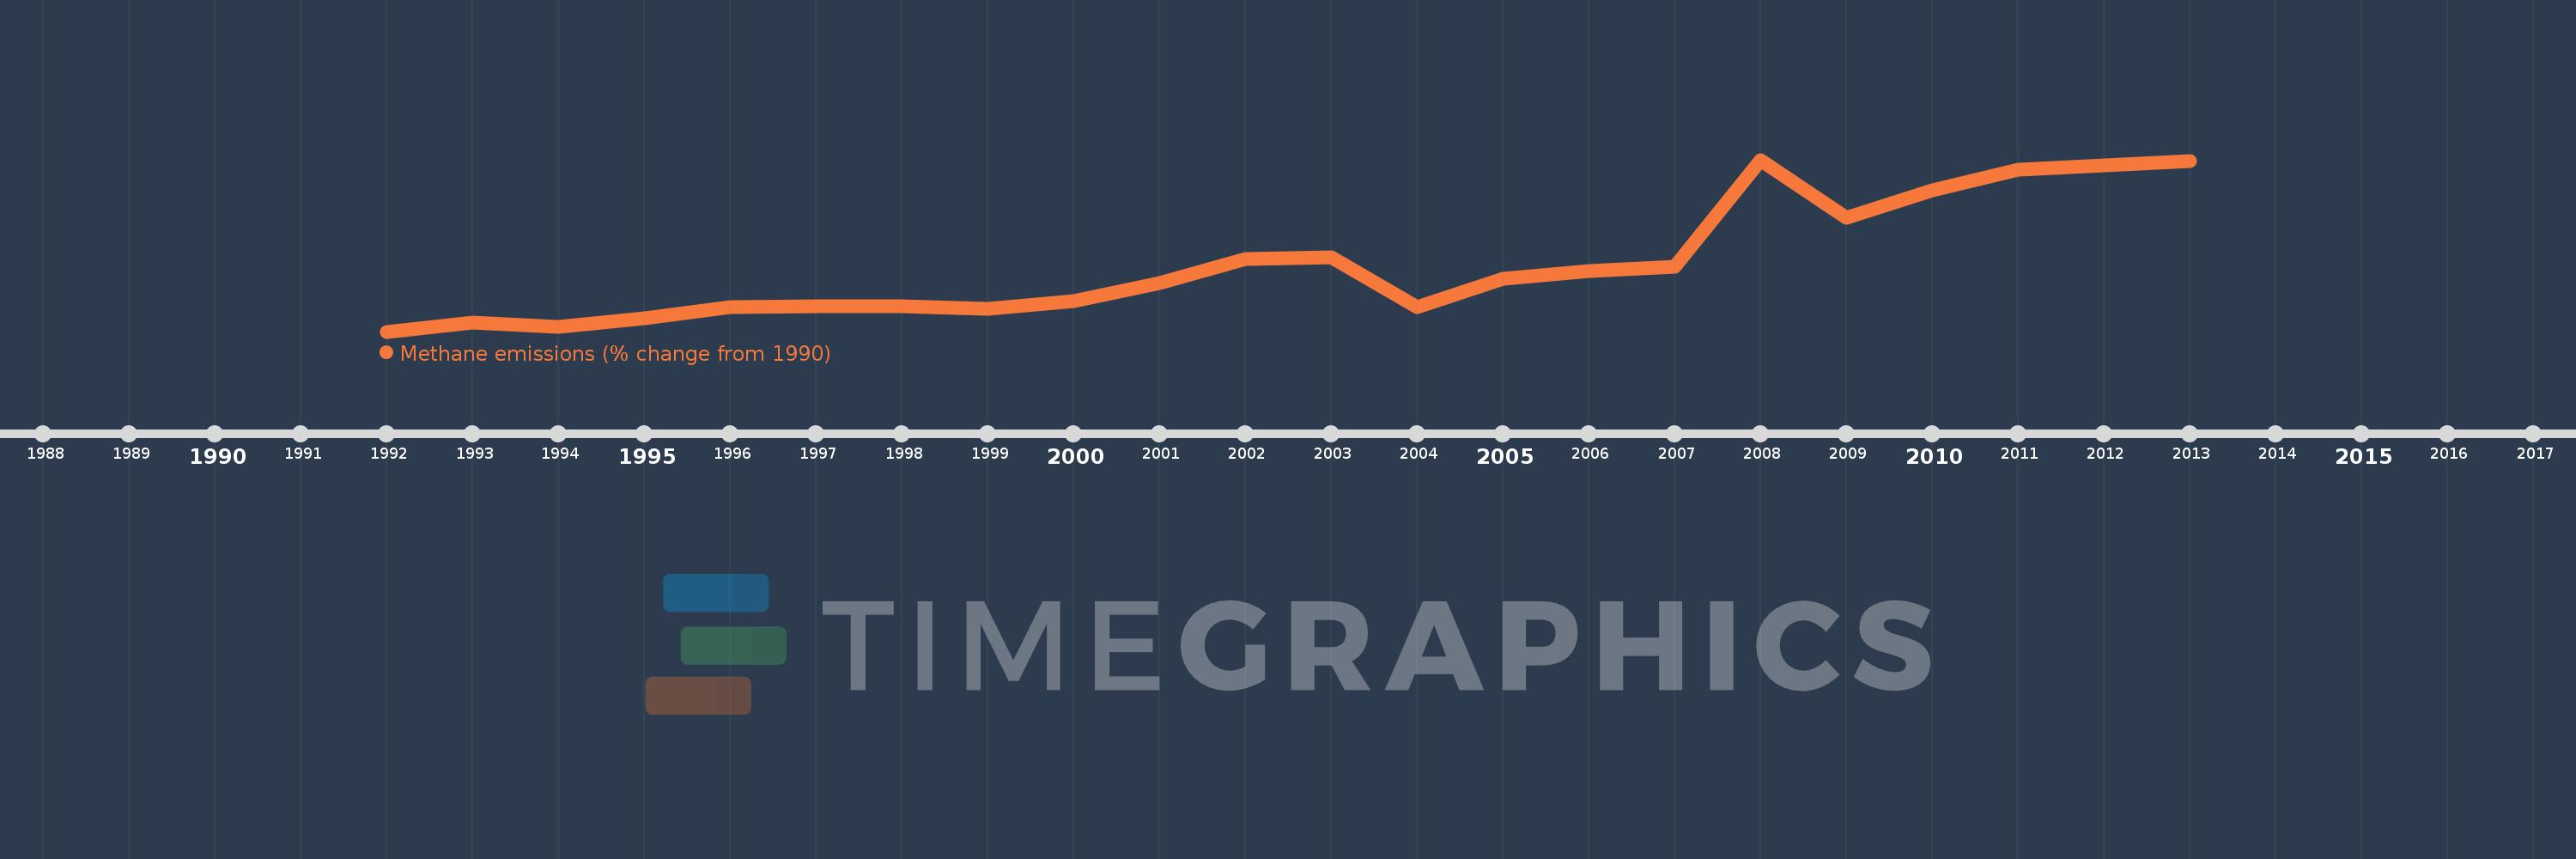
This timeline shows a graph from 1992 to 2013 of Gambia, The. No data until 1991. Number of actual observations by date: 22.
Source name:
World Development Indicators
Source organization:
World Bank staff estimates from original source: European Commission, Joint Research Centre (JRC)/Netherlands Environmental Assessment Agency (PBL). Emission Database for Global Atmospheric Research (EDGAR): http://edgar.jrc.ec.europa.eu/.
Categories, topics:
Climate Change, Environment
Last updated:
apr 23, 2017
Indicators value changes by year
Meaning:
25.553
Minimum:
-2.95
jan 1, 1992
Maximum:
69.882
jan 1, 2008
At the date of observation
Value
Absolute change
Change from the previous value
jan 1, 1992
-2.95
-2.95
0.0%
jan 1, 1993
1.054
+4.004
-135.72%
jan 1, 1994
-0.899
-1.953
-185.34%
jan 1, 1995
2.547
+3.446
-383.17%
jan 1, 1996
7.313
+4.766
187.15%
jan 1, 1997
7.917
+0.604
8.26%
jan 1, 1998
7.75
-0.166
-2.1%
jan 1, 1999
6.851
-0.899
-11.6%
jan 1, 2000
9.838
+2.987
43.6%
jan 1, 2001
17.498
+7.659
77.85%
jan 1, 2002
27.68
+10.183
58.2%
jan 1, 2003
28.547
+0.867
3.13%
jan 1, 2004
7.343
-21.205
-74.28%
jan 1, 2005
19.561
+12.218
166.4%
jan 1, 2006
22.803
+3.242
16.58%
jan 1, 2007
24.629
+1.826
8.01%
jan 1, 2008
69.882
+45.253
183.74%
jan 1, 2009
45.395
-24.486
-35.04%
jan 1, 2010
56.868
+11.472
25.27%
jan 1, 2011
65.858
+8.99
15.81%
jan 1, 2012
67.516
+1.659
2.52%
jan 1, 2013
69.175
+1.659
2.46%
Ranking of countries by current statistics by years