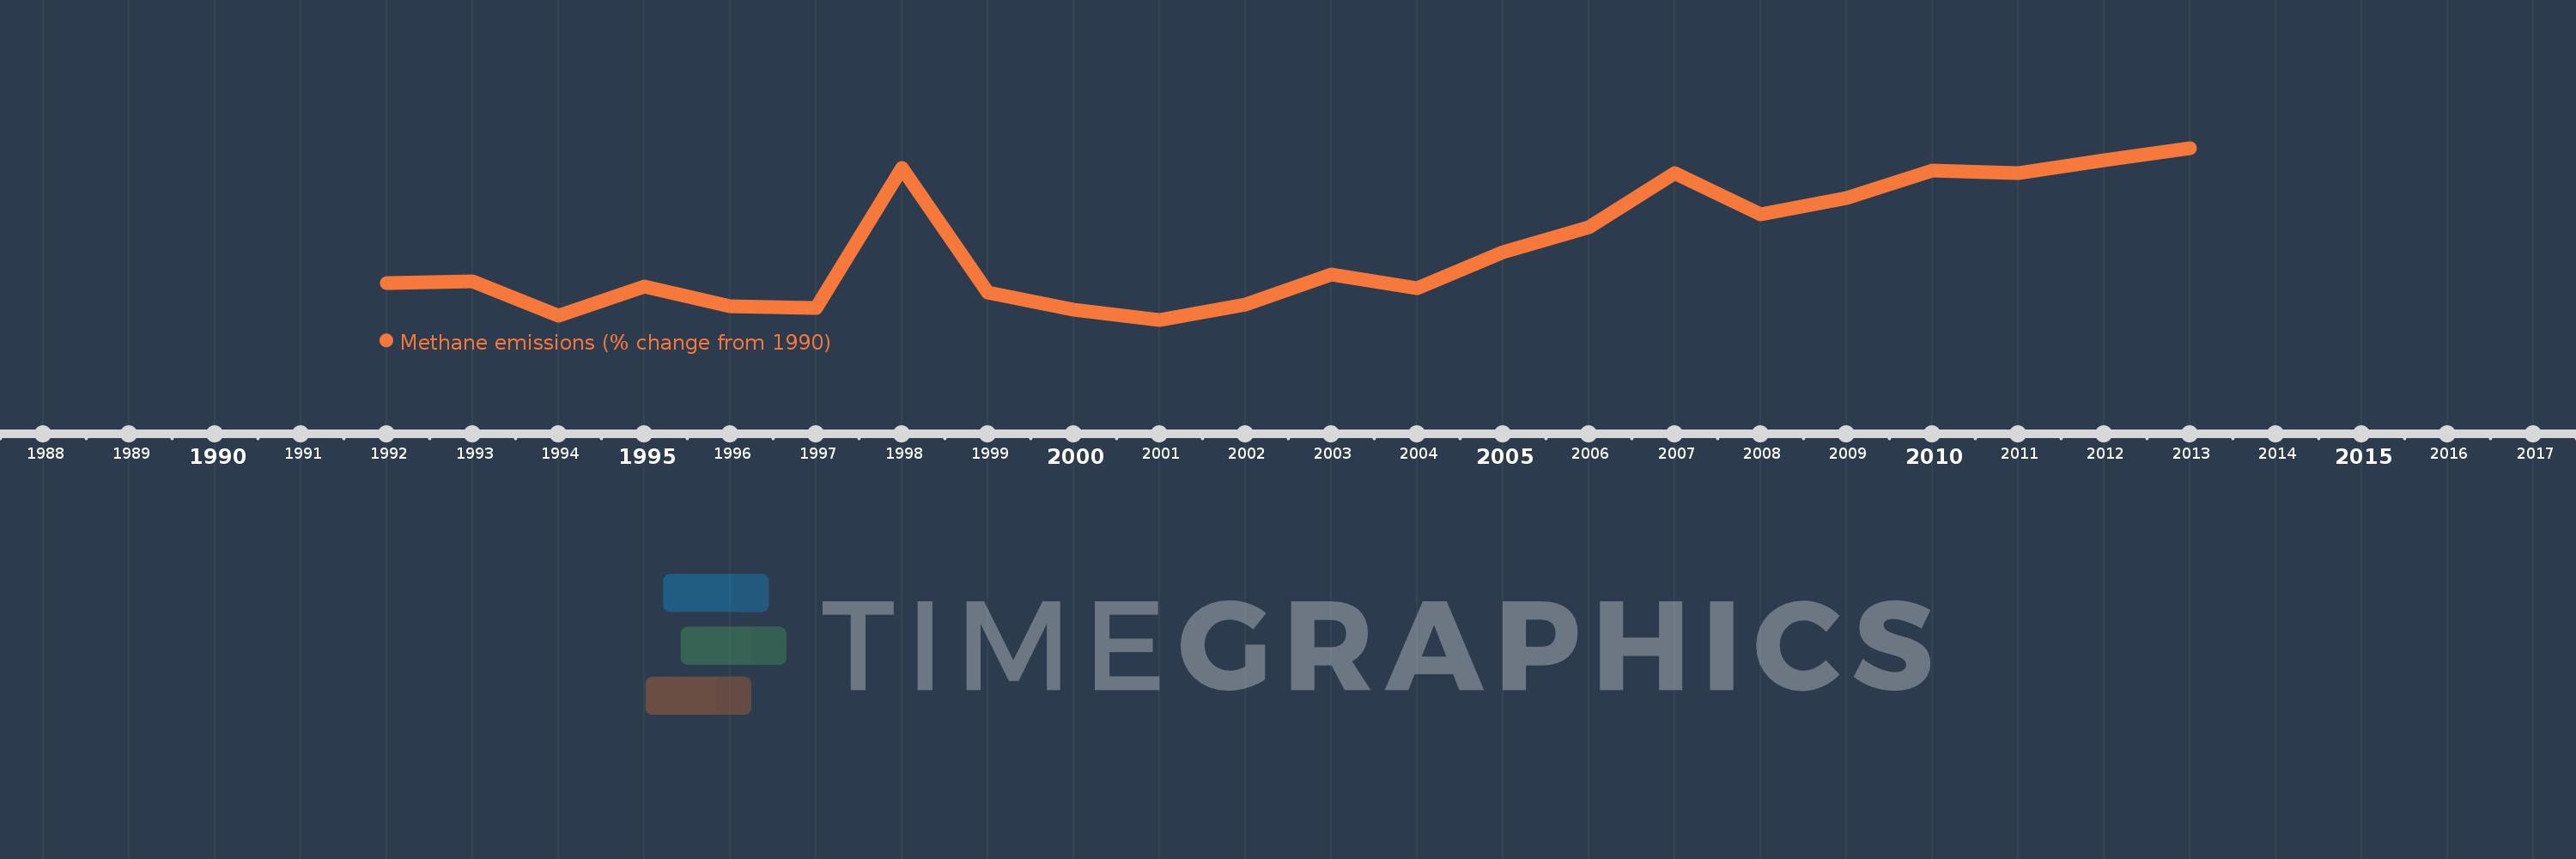
This timeline shows a graph from 1992 to 2013 of East Asia & Pacific. No data until 1991. Number of actual observations by date: 22.
Source name:
World Development Indicators
Source organization:
World Bank staff estimates from original source: European Commission, Joint Research Centre (JRC)/Netherlands Environmental Assessment Agency (PBL). Emission Database for Global Atmospheric Research (EDGAR): http://edgar.jrc.ec.europa.eu/.
Categories, topics:
Climate Change, Environment
Last updated:
apr 23, 2017
Indicators value changes by year
Meaning:
19.178
Minimum:
-0.713
jan 1, 2001
Maximum:
46.863
jan 1, 2013
At the date of observation
Value
Absolute change
Change from the previous value
jan 1, 1992
9.451
+9.451
0.0%
jan 1, 1993
9.871
+0.42
4.45%
jan 1, 1994
0.305
-9.566
-96.91%
jan 1, 1995
8.431
+8.126
2.66K%
jan 1, 1996
3.083
-5.348
-63.43%
jan 1, 1997
2.613
-0.47
-15.25%
jan 1, 1998
41.334
+38.721
1.48K%
jan 1, 1999
6.918
-34.416
-83.26%
jan 1, 2000
2.106
-4.813
-69.56%
jan 1, 2001
-0.713
-2.819
-133.88%
jan 1, 2002
3.475
+4.188
-587.08%
jan 1, 2003
11.848
+8.373
240.94%
jan 1, 2004
8.11
-3.738
-31.55%
jan 1, 2005
18.004
+9.894
122.0%
jan 1, 2006
24.882
+6.878
38.2%
jan 1, 2007
39.83
+14.948
60.08%
jan 1, 2008
28.584
-11.246
-28.24%
jan 1, 2009
32.876
+4.292
15.02%
jan 1, 2010
40.689
+7.813
23.77%
jan 1, 2011
39.944
-0.745
-1.83%
jan 1, 2012
43.403
+3.459
8.66%
jan 1, 2013
46.863
+3.46
7.97%
Ranking of countries by current statistics by years