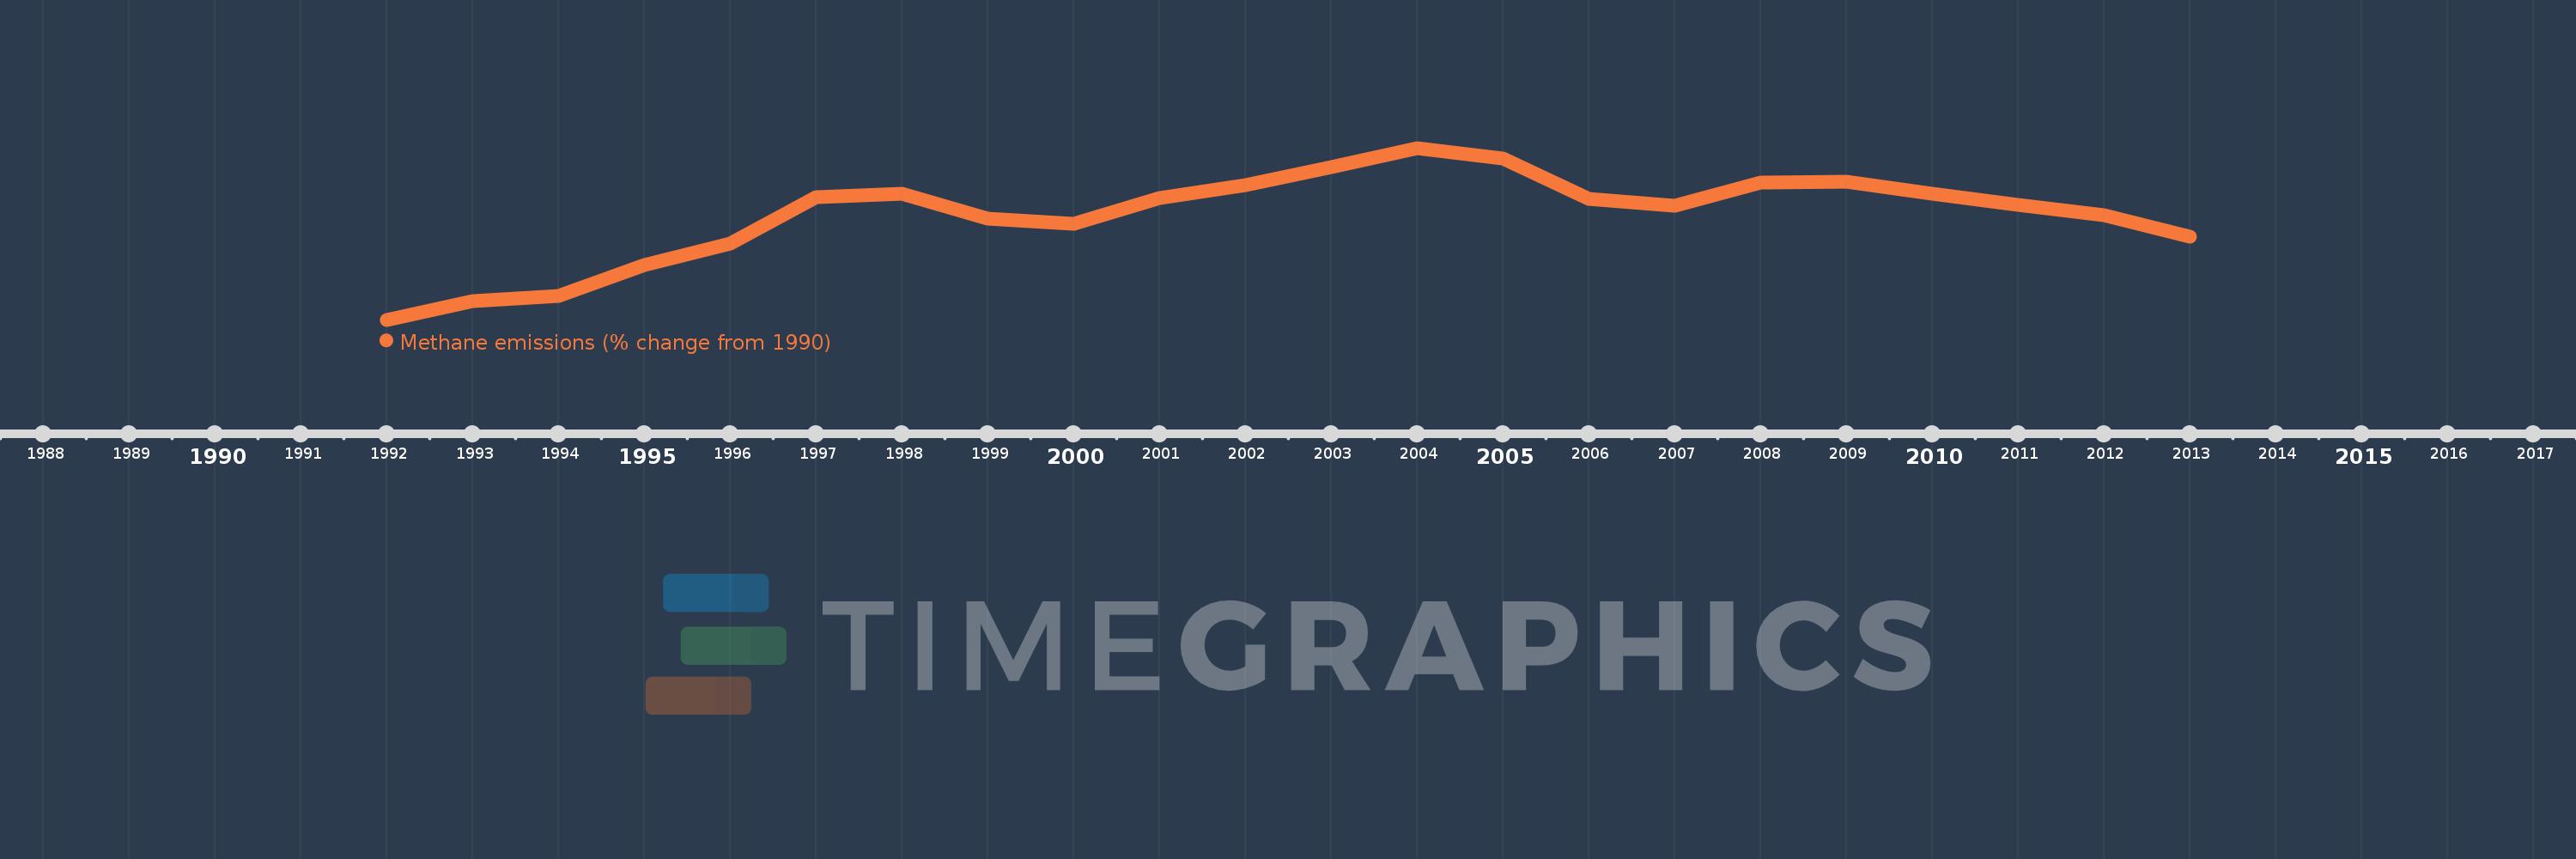
This timeline shows a graph from 1992 to 2013 of Norway. No data until 1991. Number of actual observations by date: 22.
Source name:
World Development Indicators
Source organization:
World Bank staff estimates from original source: European Commission, Joint Research Centre (JRC)/Netherlands Environmental Assessment Agency (PBL). Emission Database for Global Atmospheric Research (EDGAR): http://edgar.jrc.ec.europa.eu/.
Categories, topics:
Climate Change, Environment
Last updated:
apr 23, 2017
Indicators value changes by year
Meaning:
18.79
Minimum:
1.64
jan 1, 1992
Maximum:
29.852
jan 1, 2004
At the date of observation
Value
Absolute change
Change from the previous value
jan 1, 1992
1.64
+1.64
0.0%
jan 1, 1993
4.658
+3.018
183.98%
jan 1, 1994
5.538
+0.881
18.91%
jan 1, 1995
10.66
+5.121
92.47%
jan 1, 1996
14.216
+3.556
33.36%
jan 1, 1997
21.746
+7.53
52.97%
jan 1, 1998
22.354
+0.608
2.8%
jan 1, 1999
18.26
-4.094
-18.31%
jan 1, 2000
17.363
-0.898
-4.92%
jan 1, 2001
21.598
+4.236
24.39%
jan 1, 2002
23.68
+2.082
9.64%
jan 1, 2003
26.687
+3.007
12.7%
jan 1, 2004
29.852
+3.165
11.86%
jan 1, 2005
28.058
-1.795
-6.01%
jan 1, 2006
21.425
-6.633
-23.64%
jan 1, 2007
20.323
-1.102
-5.14%
jan 1, 2008
24.199
+3.877
19.08%
jan 1, 2009
24.331
+0.131
0.54%
jan 1, 2010
22.27
-2.06
-8.47%
jan 1, 2011
20.448
-1.822
-8.18%
jan 1, 2012
18.807
-1.641
-8.03%
jan 1, 2013
15.257
-3.55
-18.88%
Ranking of countries by current statistics by years