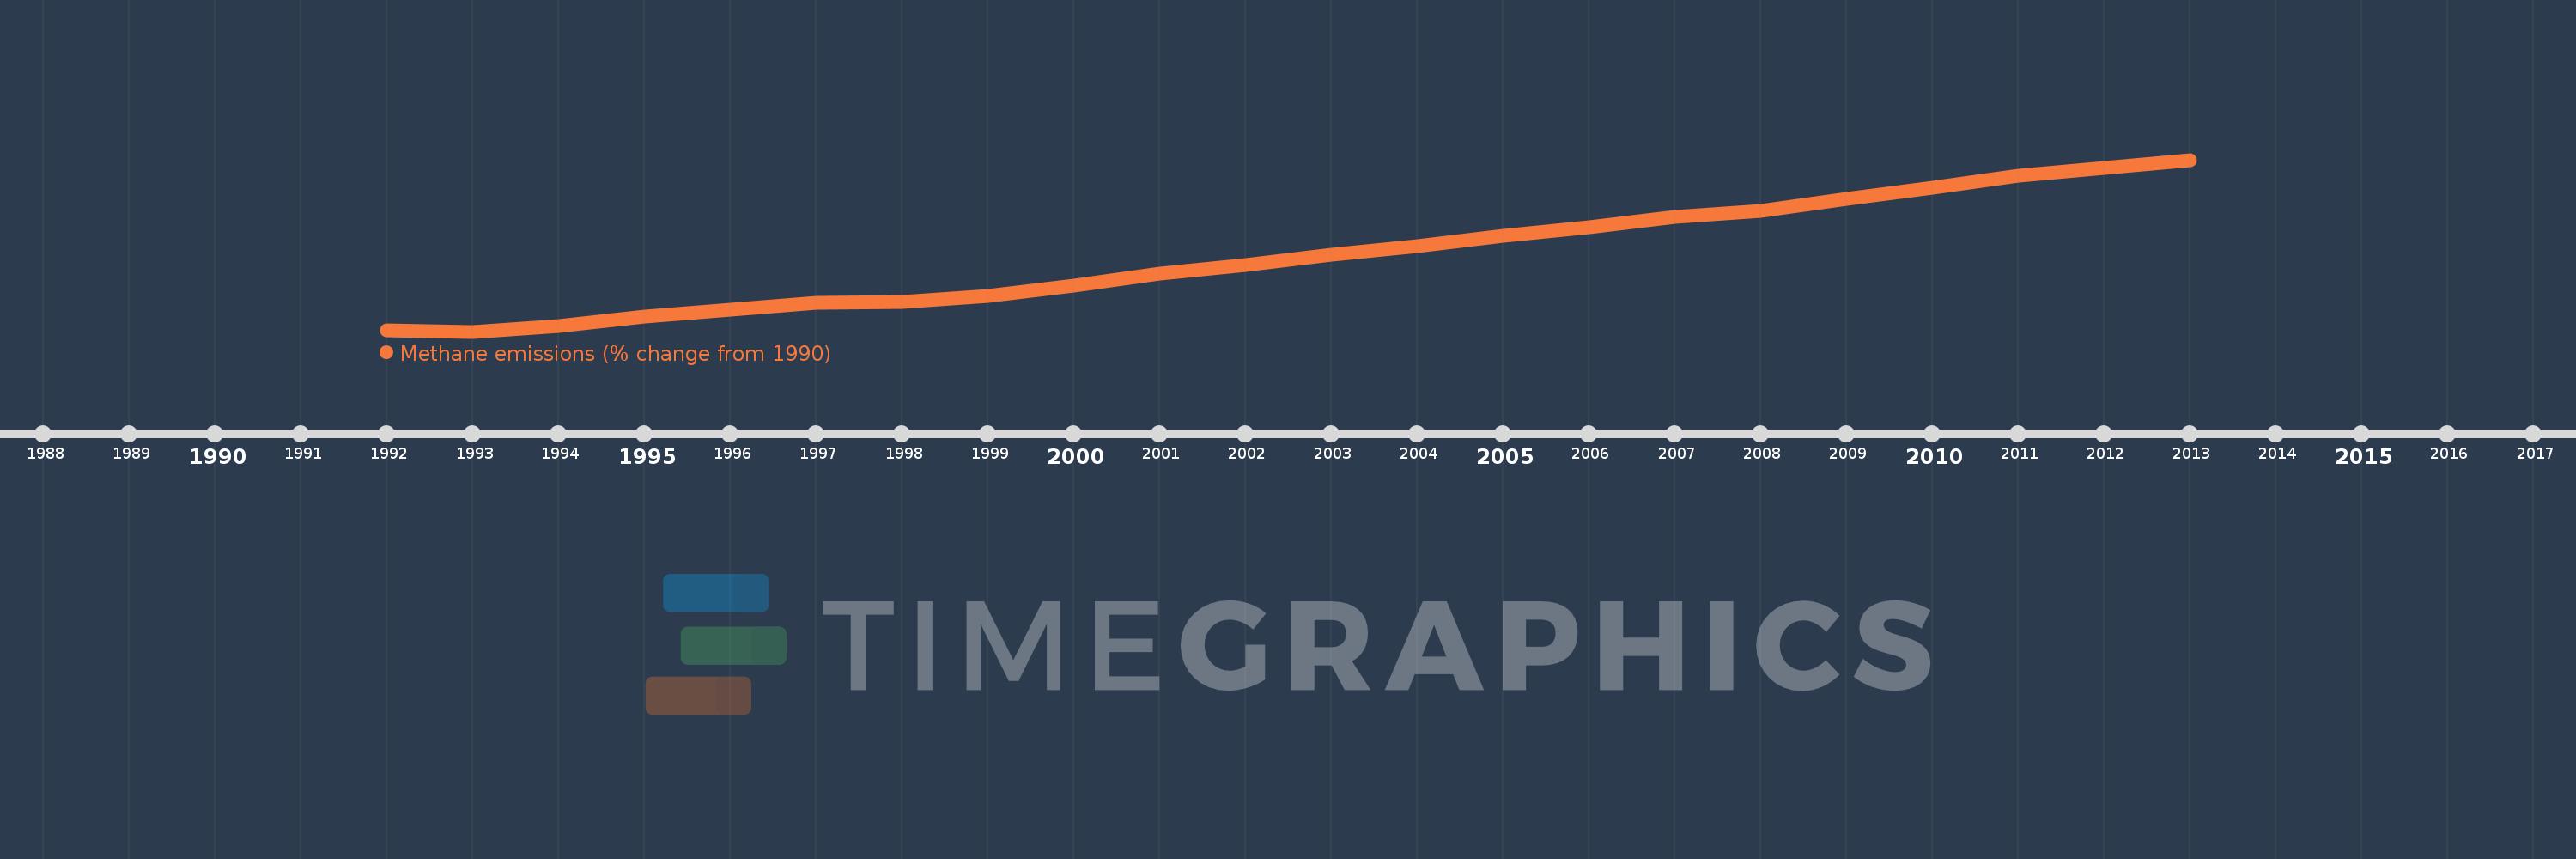
This timeline shows a graph from 1992 to 2013 of Bermuda. No data until 1991. Number of actual observations by date: 22.
Source name:
World Development Indicators
Source organization:
World Bank staff estimates from original source: European Commission, Joint Research Centre (JRC)/Netherlands Environmental Assessment Agency (PBL). Emission Database for Global Atmospheric Research (EDGAR): http://edgar.jrc.ec.europa.eu/.
Categories, topics:
Climate Change, Environment
Last updated:
apr 23, 2017
Indicators value changes by year
Meaning:
13.02
Minimum:
0.637
jan 1, 1993
Maximum:
28.565
jan 1, 2013
At the date of observation
Value
Absolute change
Change from the previous value
jan 1, 1992
0.787
+0.787
0.0%
jan 1, 1993
0.637
-0.15
-19.1%
jan 1, 1994
1.585
+0.948
148.99%
jan 1, 1995
3.144
+1.559
98.38%
jan 1, 1996
4.252
+1.108
35.24%
jan 1, 1997
5.337
+1.085
25.52%
jan 1, 1998
5.408
+0.07
1.31%
jan 1, 1999
6.442
+1.035
19.14%
jan 1, 2000
8.144
+1.701
26.41%
jan 1, 2001
10.115
+1.972
24.21%
jan 1, 2002
11.45
+1.334
13.19%
jan 1, 2003
13.084
+1.634
14.27%
jan 1, 2004
14.538
+1.455
11.12%
jan 1, 2005
16.25
+1.711
11.77%
jan 1, 2006
17.608
+1.358
8.36%
jan 1, 2007
19.247
+1.64
9.31%
jan 1, 2008
20.266
+1.018
5.29%
jan 1, 2009
22.167
+1.901
9.38%
jan 1, 2010
24.076
+1.909
8.61%
jan 1, 2011
26.044
+1.968
8.17%
jan 1, 2012
27.304
+1.26
4.84%
jan 1, 2013
28.565
+1.26
4.62%
Ranking of countries by current statistics by years