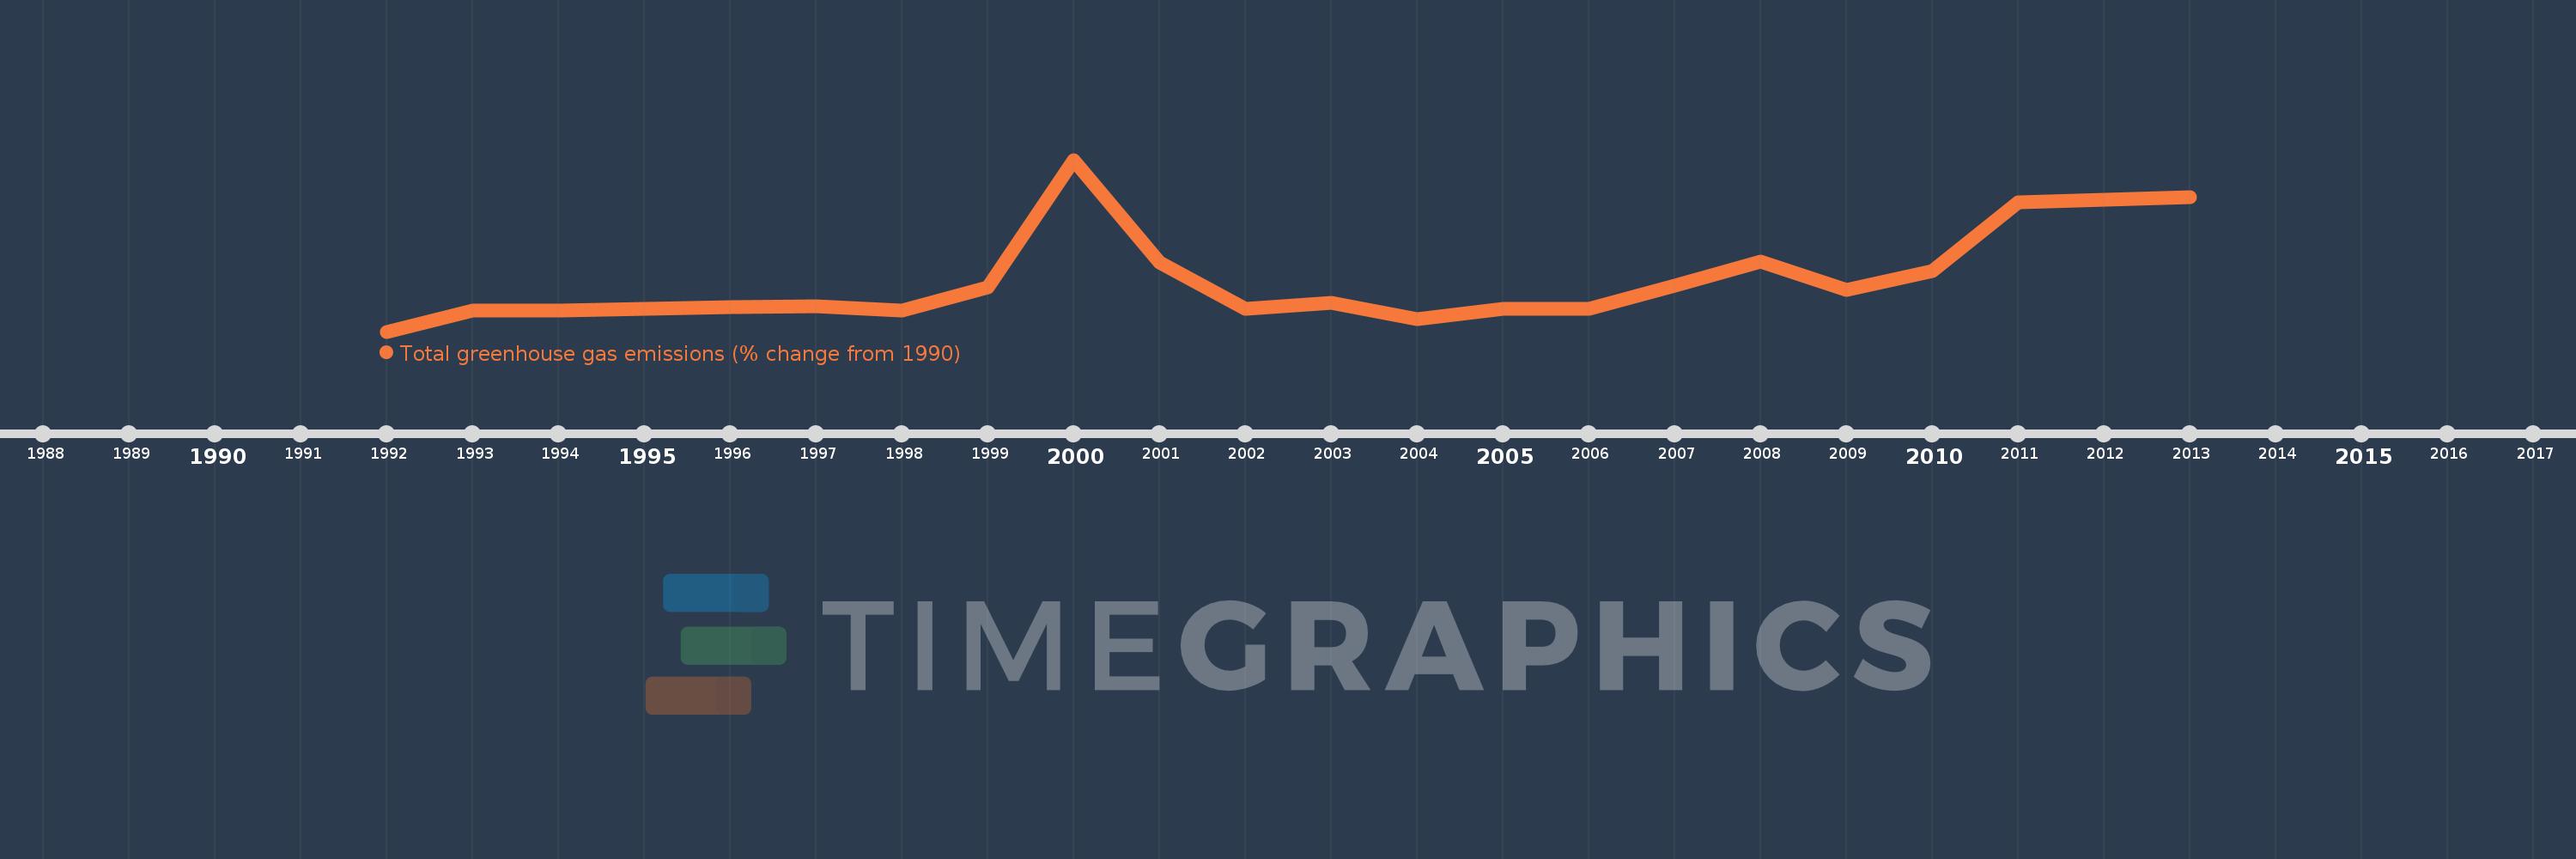
This timeline shows a graph from 1992 to 2013 of Bhutan. No data until 1991. Number of actual observations by date: 22.
Source name:
World Development Indicators
Source organization:
World Bank staff estimates from original source: European Commission, Joint Research Centre (JRC)/Netherlands Environmental Assessment Agency (PBL). Emission Database for Global Atmospheric Research (EDGAR): http://edgar.jrc.ec.europa.eu/.
Categories, topics:
Climate Change, Environment
Last updated:
apr 23, 2017
Indicators value changes by year
Meaning:
60.838
Minimum:
-0.252
jan 1, 1992
Maximum:
201.339
jan 1, 2000
At the date of observation
Value
Absolute change
Change from the previous value
jan 1, 1992
-0.252
-0.252
0.0%
jan 1, 1993
24.594
+24.846
-9.86K%
jan 1, 1994
24.381
-0.213
-0.86%
jan 1, 1995
26.132
+1.751
7.18%
jan 1, 1996
28.727
+2.595
9.93%
jan 1, 1997
29.98
+1.253
4.36%
jan 1, 1998
24.76
-5.22
-17.41%
jan 1, 1999
51.787
+27.027
109.16%
jan 1, 2000
201.339
+149.552
288.79%
jan 1, 2001
80.43
-120.909
-60.05%
jan 1, 2002
26.039
-54.391
-67.63%
jan 1, 2003
33.391
+7.353
28.24%
jan 1, 2004
14.641
-18.75
-56.15%
jan 1, 2005
26.802
+12.16
83.05%
jan 1, 2006
26.382
-0.42
-1.57%
jan 1, 2007
53.604
+27.223
103.19%
jan 1, 2008
81.742
+28.137
52.49%
jan 1, 2009
49.068
-32.673
-39.97%
jan 1, 2010
71.147
+22.078
45.0%
jan 1, 2011
151.566
+80.419
113.03%
jan 1, 2012
154.628
+3.063
2.02%
jan 1, 2013
157.546
+2.918
1.89%
Ranking of countries by current statistics by years