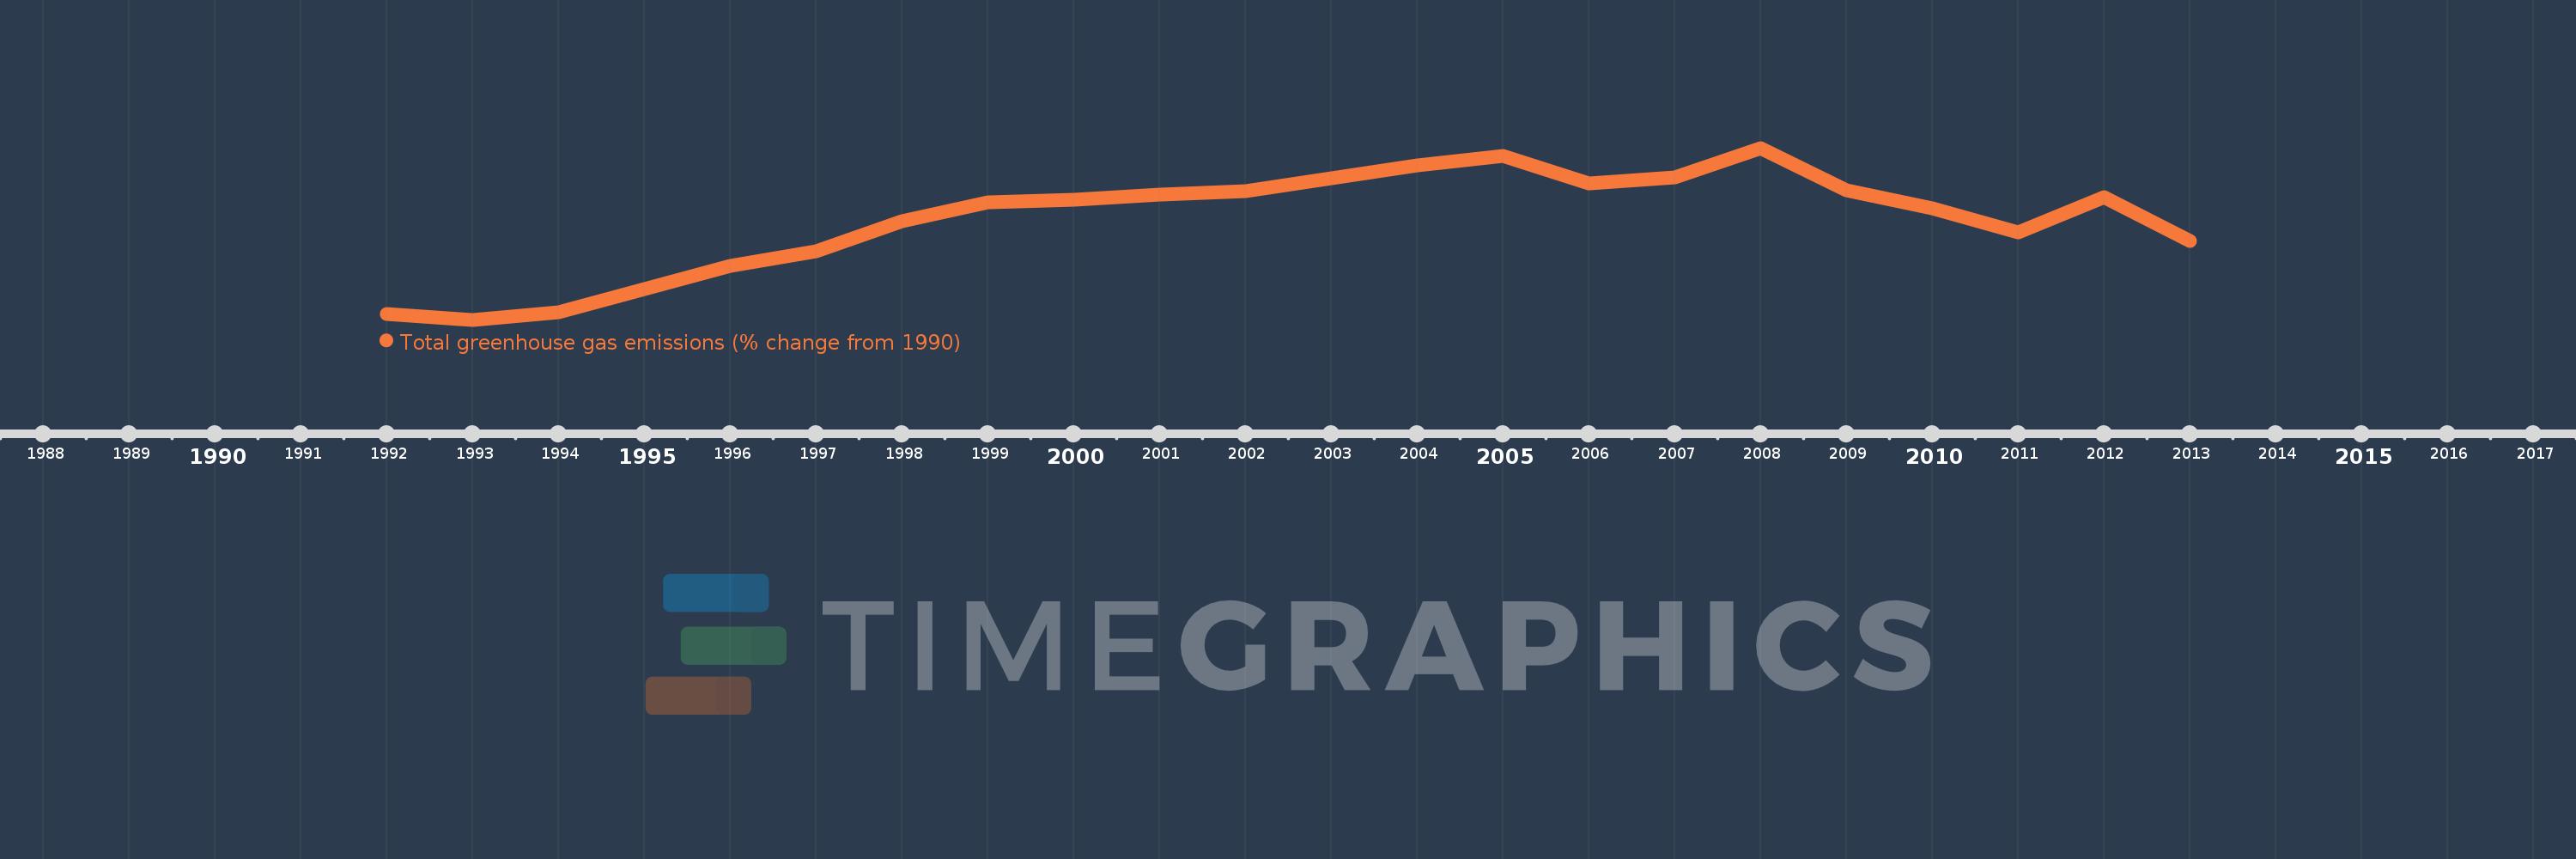
This timeline shows a graph from 1992 to 2013 of High income. No data until 1991. Number of actual observations by date: 22.
Source name:
World Development Indicators
Source organization:
World Bank staff estimates from original source: European Commission, Joint Research Centre (JRC)/Netherlands Environmental Assessment Agency (PBL). Emission Database for Global Atmospheric Research (EDGAR): http://edgar.jrc.ec.europa.eu/.
Categories, topics:
Climate Change, Environment
Last updated:
apr 23, 2017
Indicators value changes by year
Meaning:
11.218
Minimum:
-0.327
jan 1, 1993
Maximum:
19.557
jan 1, 2008
At the date of observation
Value
Absolute change
Change from the previous value
jan 1, 1992
0.327
+0.327
0.0%
jan 1, 1993
-0.327
-0.654
-200.15%
jan 1, 1994
0.53
+0.857
-261.86%
jan 1, 1995
3.178
+2.648
499.84%
jan 1, 1996
5.858
+2.681
84.37%
jan 1, 1997
7.606
+1.747
29.82%
jan 1, 1998
11.036
+3.43
45.1%
jan 1, 1999
13.256
+2.221
20.12%
jan 1, 2000
13.518
+0.262
1.98%
jan 1, 2001
14.117
+0.599
4.43%
jan 1, 2002
14.581
+0.464
3.29%
jan 1, 2003
16.02
+1.438
9.87%
jan 1, 2004
17.553
+1.534
9.57%
jan 1, 2005
18.666
+1.113
6.34%
jan 1, 2006
15.483
-3.184
-17.06%
jan 1, 2007
16.118
+0.636
4.11%
jan 1, 2008
19.557
+3.438
21.33%
jan 1, 2009
14.685
-4.872
-24.91%
jan 1, 2010
12.568
-2.117
-14.41%
jan 1, 2011
9.751
-2.817
-22.42%
jan 1, 2012
13.884
+4.133
42.39%
jan 1, 2013
8.829
-5.055
-36.41%
Ranking of countries by current statistics by years