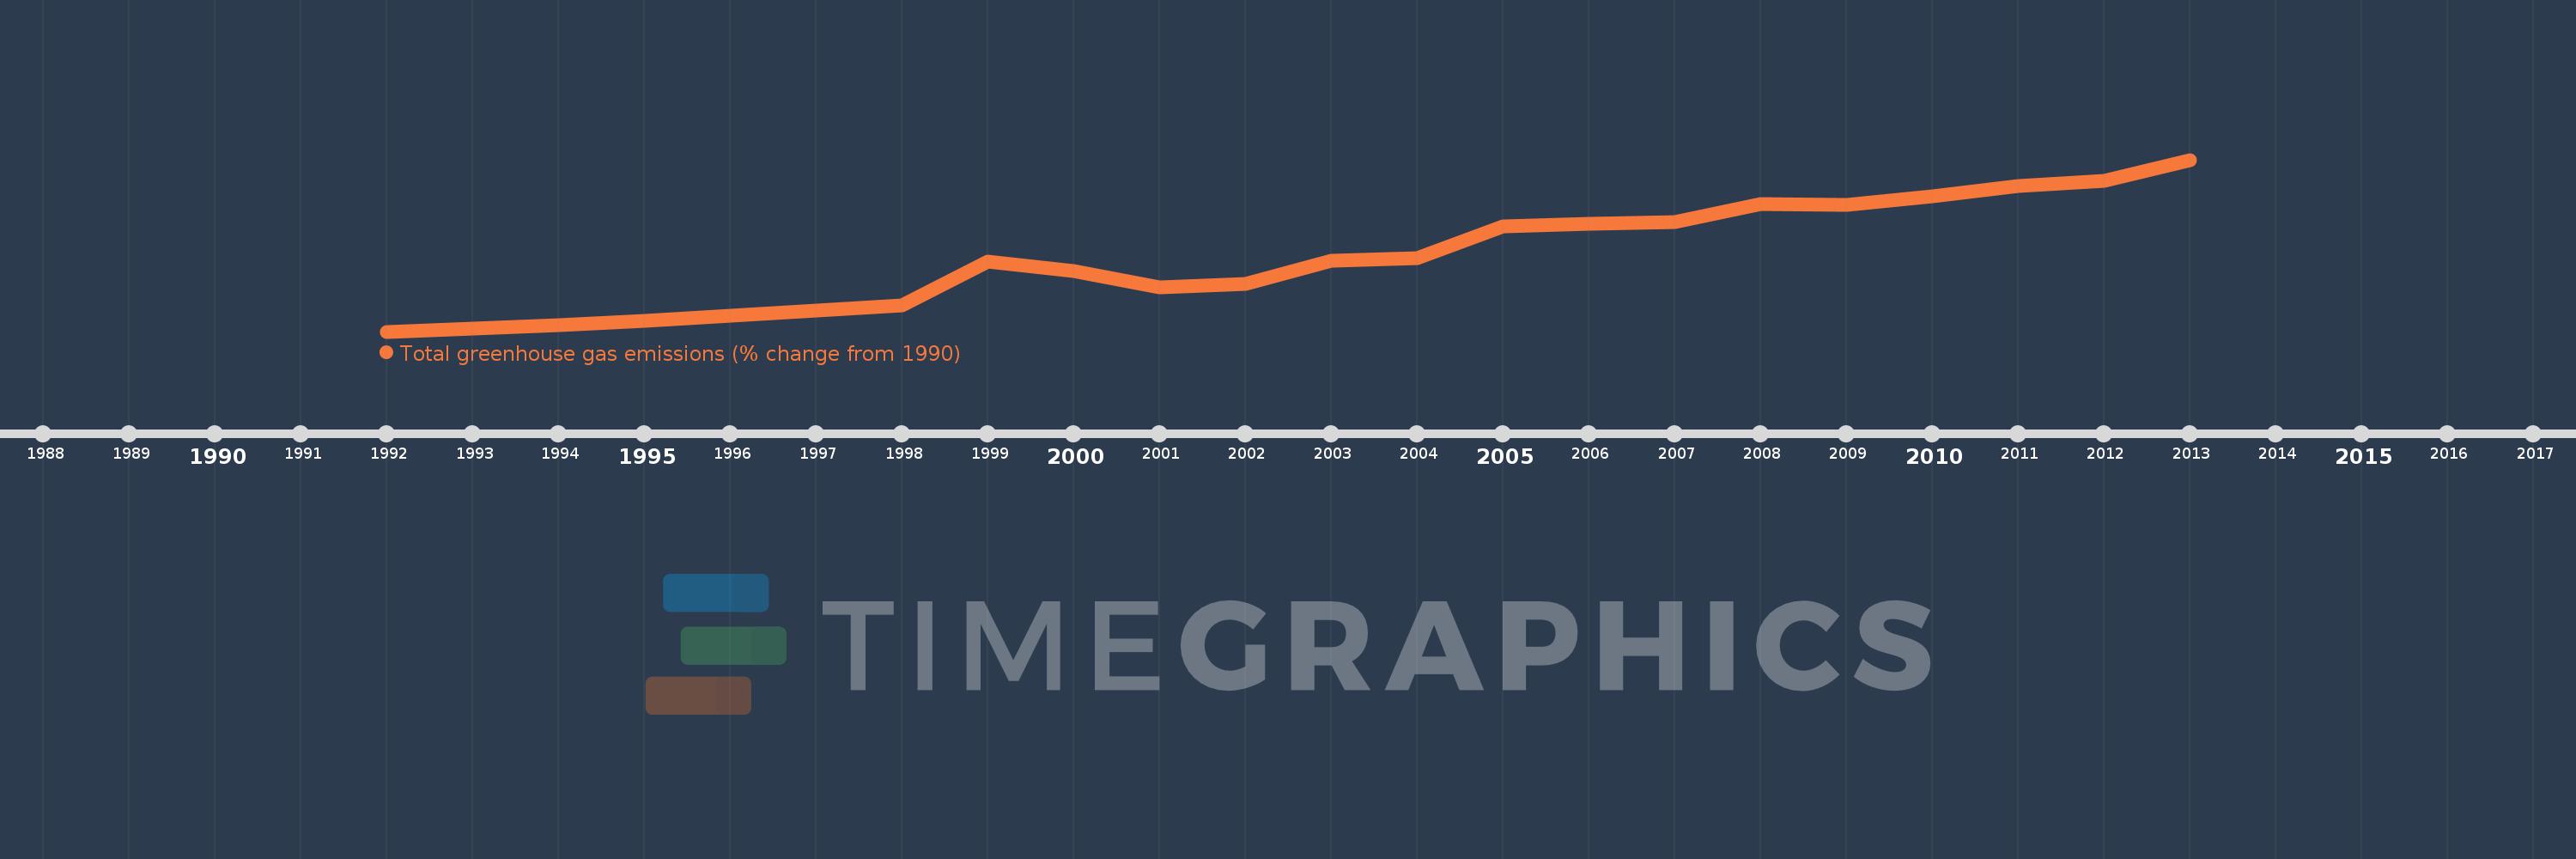
This timeline shows a graph from 1992 to 2013 of Vietnam. No data until 1991. Number of actual observations by date: 22.
Source name:
World Development Indicators
Source organization:
World Bank staff estimates from original source: European Commission, Joint Research Centre (JRC)/Netherlands Environmental Assessment Agency (PBL). Emission Database for Global Atmospheric Research (EDGAR): http://edgar.jrc.ec.europa.eu/.
Categories, topics:
Climate Change, Environment
Last updated:
apr 23, 2017
Indicators value changes by year
Meaning:
93.46
Minimum:
2.458
jan 1, 1992
Maximum:
213.631
jan 1, 2013
At the date of observation
Value
Absolute change
Change from the previous value
jan 1, 1992
2.458
+2.458
0.0%
jan 1, 1993
5.779
+3.321
135.14%
jan 1, 1994
9.911
+4.132
71.5%
jan 1, 1995
15.14
+5.229
52.76%
jan 1, 1996
21.812
+6.672
44.07%
jan 1, 1997
28.489
+6.677
30.61%
jan 1, 1998
34.973
+6.484
22.76%
jan 1, 1999
88.471
+53.499
152.97%
jan 1, 2000
77.26
-11.211
-12.67%
jan 1, 2001
57.28
-19.98
-25.86%
jan 1, 2002
61.491
+4.211
7.35%
jan 1, 2003
89.508
+28.017
45.56%
jan 1, 2004
92.238
+2.73
3.05%
jan 1, 2005
131.411
+39.173
42.47%
jan 1, 2006
134.731
+3.319
2.53%
jan 1, 2007
136.598
+1.867
1.39%
jan 1, 2008
158.846
+22.248
16.29%
jan 1, 2009
157.99
-0.855
-0.54%
jan 1, 2010
168.623
+10.633
6.73%
jan 1, 2011
181.659
+13.036
7.73%
jan 1, 2012
187.814
+6.155
3.39%
jan 1, 2013
213.631
+25.817
13.75%
Ranking of countries by current statistics by years