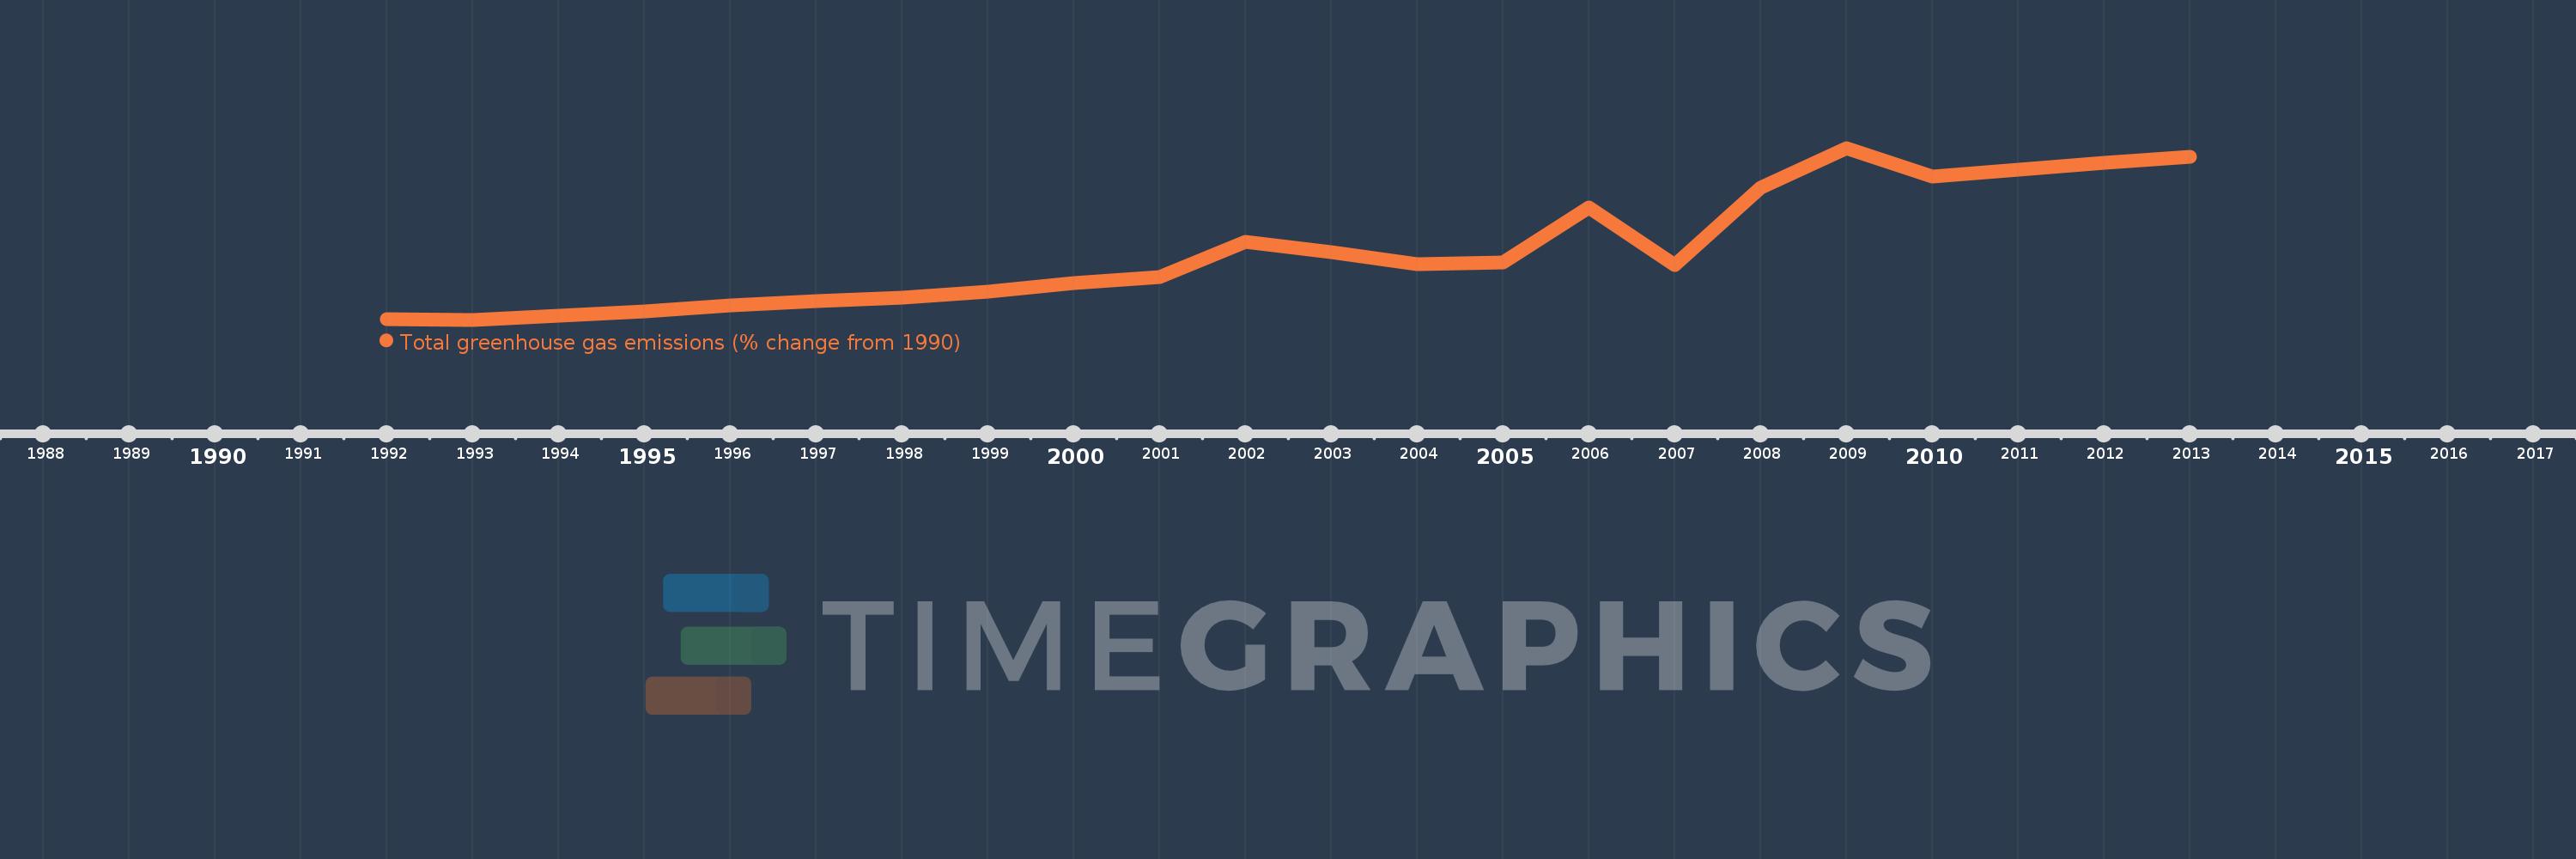
This timeline shows a graph from 1992 to 2013 of Comoros. No data until 1991. Number of actual observations by date: 22.
Source name:
World Development Indicators
Source organization:
World Bank staff estimates from original source: European Commission, Joint Research Centre (JRC)/Netherlands Environmental Assessment Agency (PBL). Emission Database for Global Atmospheric Research (EDGAR): http://edgar.jrc.ec.europa.eu/.
Categories, topics:
Climate Change, Environment
Last updated:
apr 23, 2017
Indicators value changes by year
Meaning:
38.928
Minimum:
0.158
jan 1, 1993
Maximum:
96.722
jan 1, 2009
At the date of observation
Value
Absolute change
Change from the previous value
jan 1, 1992
0.337
+0.337
0.0%
jan 1, 1993
0.158
-0.179
-53.08%
jan 1, 1994
2.485
+2.327
1.47K%
jan 1, 1995
4.721
+2.236
89.99%
jan 1, 1996
8.011
+3.29
69.7%
jan 1, 1997
10.456
+2.445
30.52%
jan 1, 1998
12.575
+2.119
20.27%
jan 1, 1999
16.055
+3.48
27.67%
jan 1, 2000
20.755
+4.7
29.27%
jan 1, 2001
24.3
+3.545
17.08%
jan 1, 2002
43.911
+19.612
80.71%
jan 1, 2003
38.012
-5.899
-13.43%
jan 1, 2004
31.579
-6.433
-16.92%
jan 1, 2005
32.361
+0.782
2.48%
jan 1, 2006
63.346
+30.984
95.74%
jan 1, 2007
30.883
-32.462
-51.25%
jan 1, 2008
74.491
+43.608
141.2%
jan 1, 2009
96.722
+22.23
29.84%
jan 1, 2010
80.612
-16.11
-16.66%
jan 1, 2011
84.672
+4.06
5.04%
jan 1, 2012
88.311
+3.639
4.3%
jan 1, 2013
91.669
+3.358
3.8%
Ranking of countries by current statistics by years