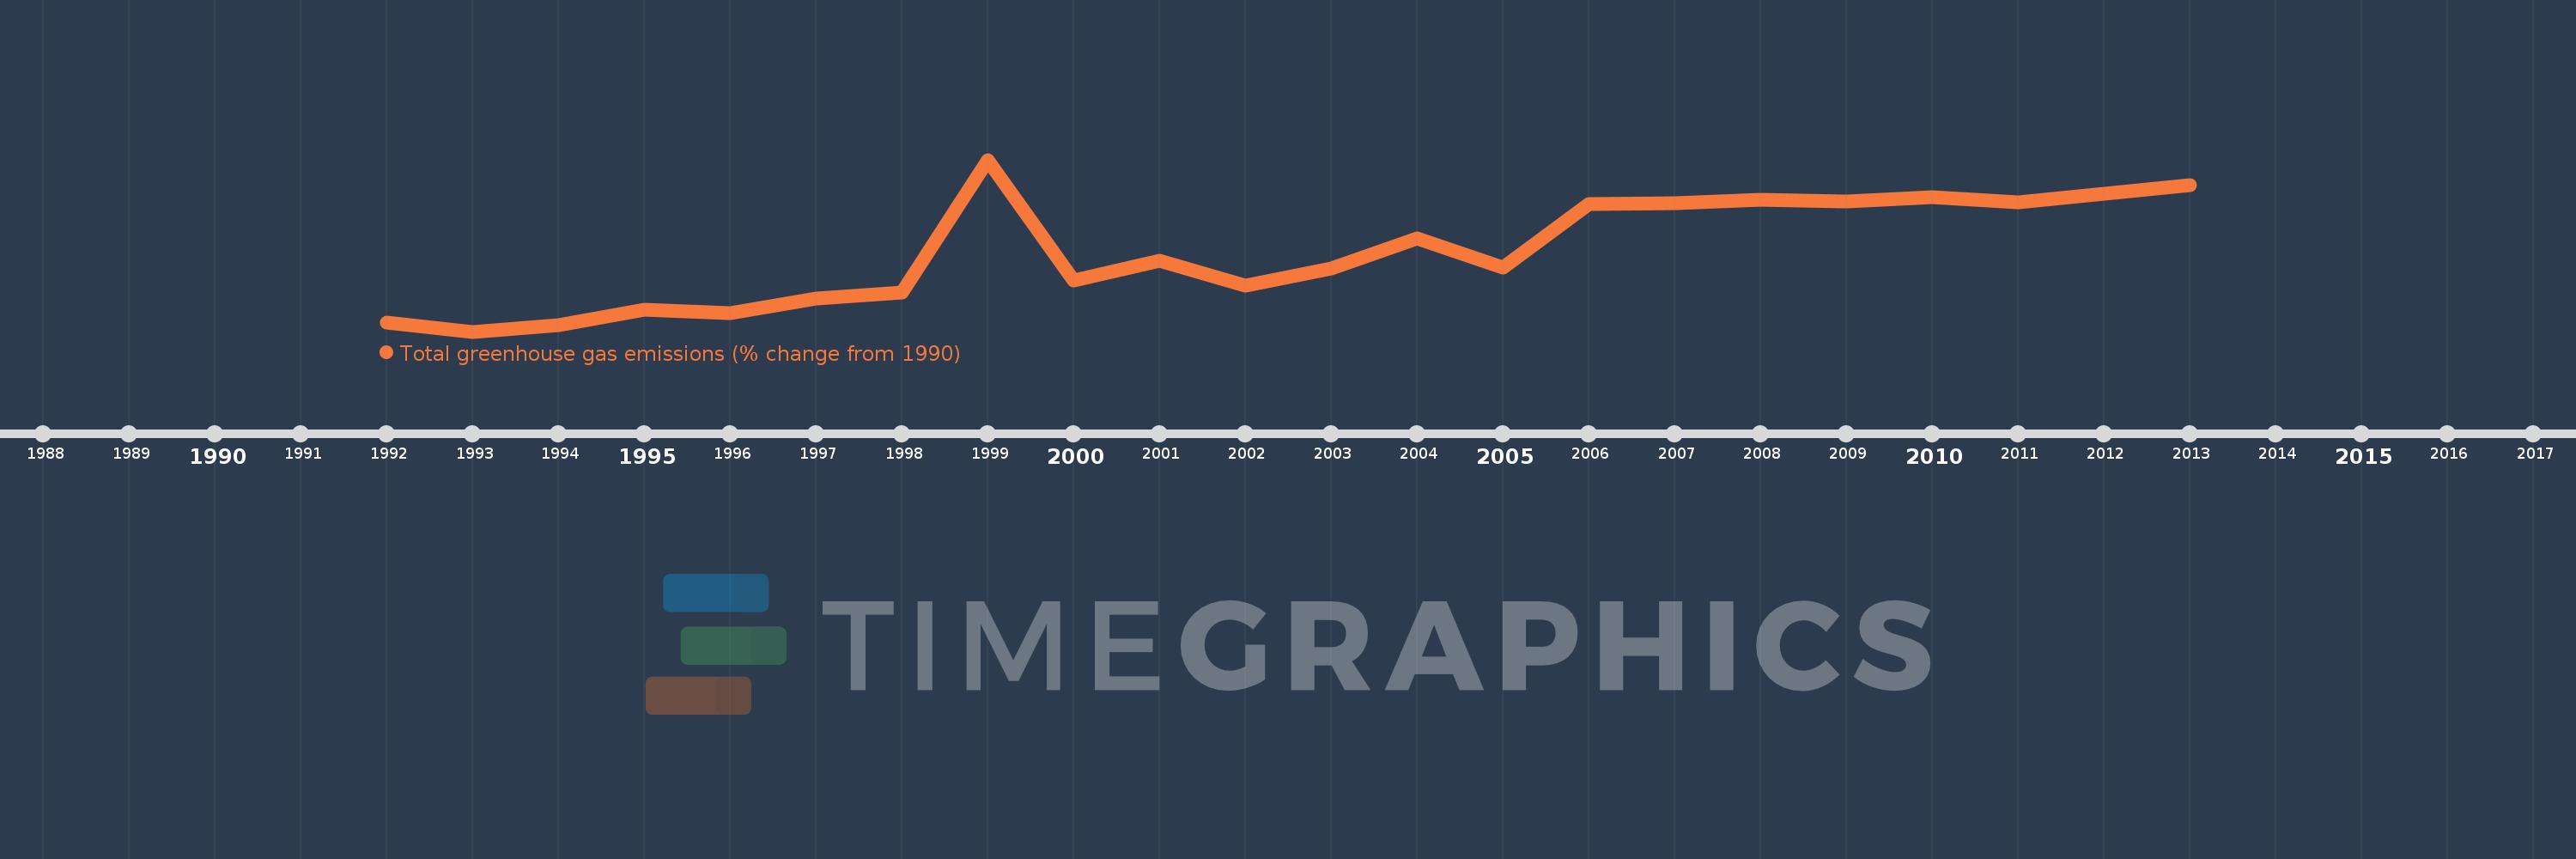
This timeline shows a graph from 1992 to 2013 of Mexico. No data until 1991. Number of actual observations by date: 22.
Source name:
World Development Indicators
Source organization:
World Bank staff estimates from original source: European Commission, Joint Research Centre (JRC)/Netherlands Environmental Assessment Agency (PBL). Emission Database for Global Atmospheric Research (EDGAR): http://edgar.jrc.ec.europa.eu/.
Categories, topics:
Climate Change, Environment
Last updated:
apr 23, 2017
Indicators value changes by year
Meaning:
18.664
Minimum:
0.1
jan 1, 1993
Maximum:
40.104
jan 1, 1999
At the date of observation
Value
Absolute change
Change from the previous value
jan 1, 1992
2.231
+2.231
0.0%
jan 1, 1993
0.1
-2.131
-95.51%
jan 1, 1994
1.613
+1.513
1.51K%
jan 1, 1995
5.277
+3.664
227.16%
jan 1, 1996
4.414
-0.863
-16.36%
jan 1, 1997
7.822
+3.409
77.23%
jan 1, 1998
9.104
+1.281
16.38%
jan 1, 1999
40.104
+31.0
340.53%
jan 1, 2000
12.081
-28.023
-69.88%
jan 1, 2001
16.663
+4.582
37.93%
jan 1, 2002
10.889
-5.773
-34.65%
jan 1, 2003
14.88
+3.99
36.65%
jan 1, 2004
21.762
+6.882
46.25%
jan 1, 2005
14.902
-6.859
-31.52%
jan 1, 2006
29.78
+14.878
99.84%
jan 1, 2007
29.948
+0.168
0.56%
jan 1, 2008
30.794
+0.846
2.83%
jan 1, 2009
30.359
-0.435
-1.41%
jan 1, 2010
31.308
+0.95
3.13%
jan 1, 2011
30.198
-1.11
-3.55%
jan 1, 2012
32.118
+1.92
6.36%
jan 1, 2013
34.256
+2.138
6.66%
Ranking of countries by current statistics by years