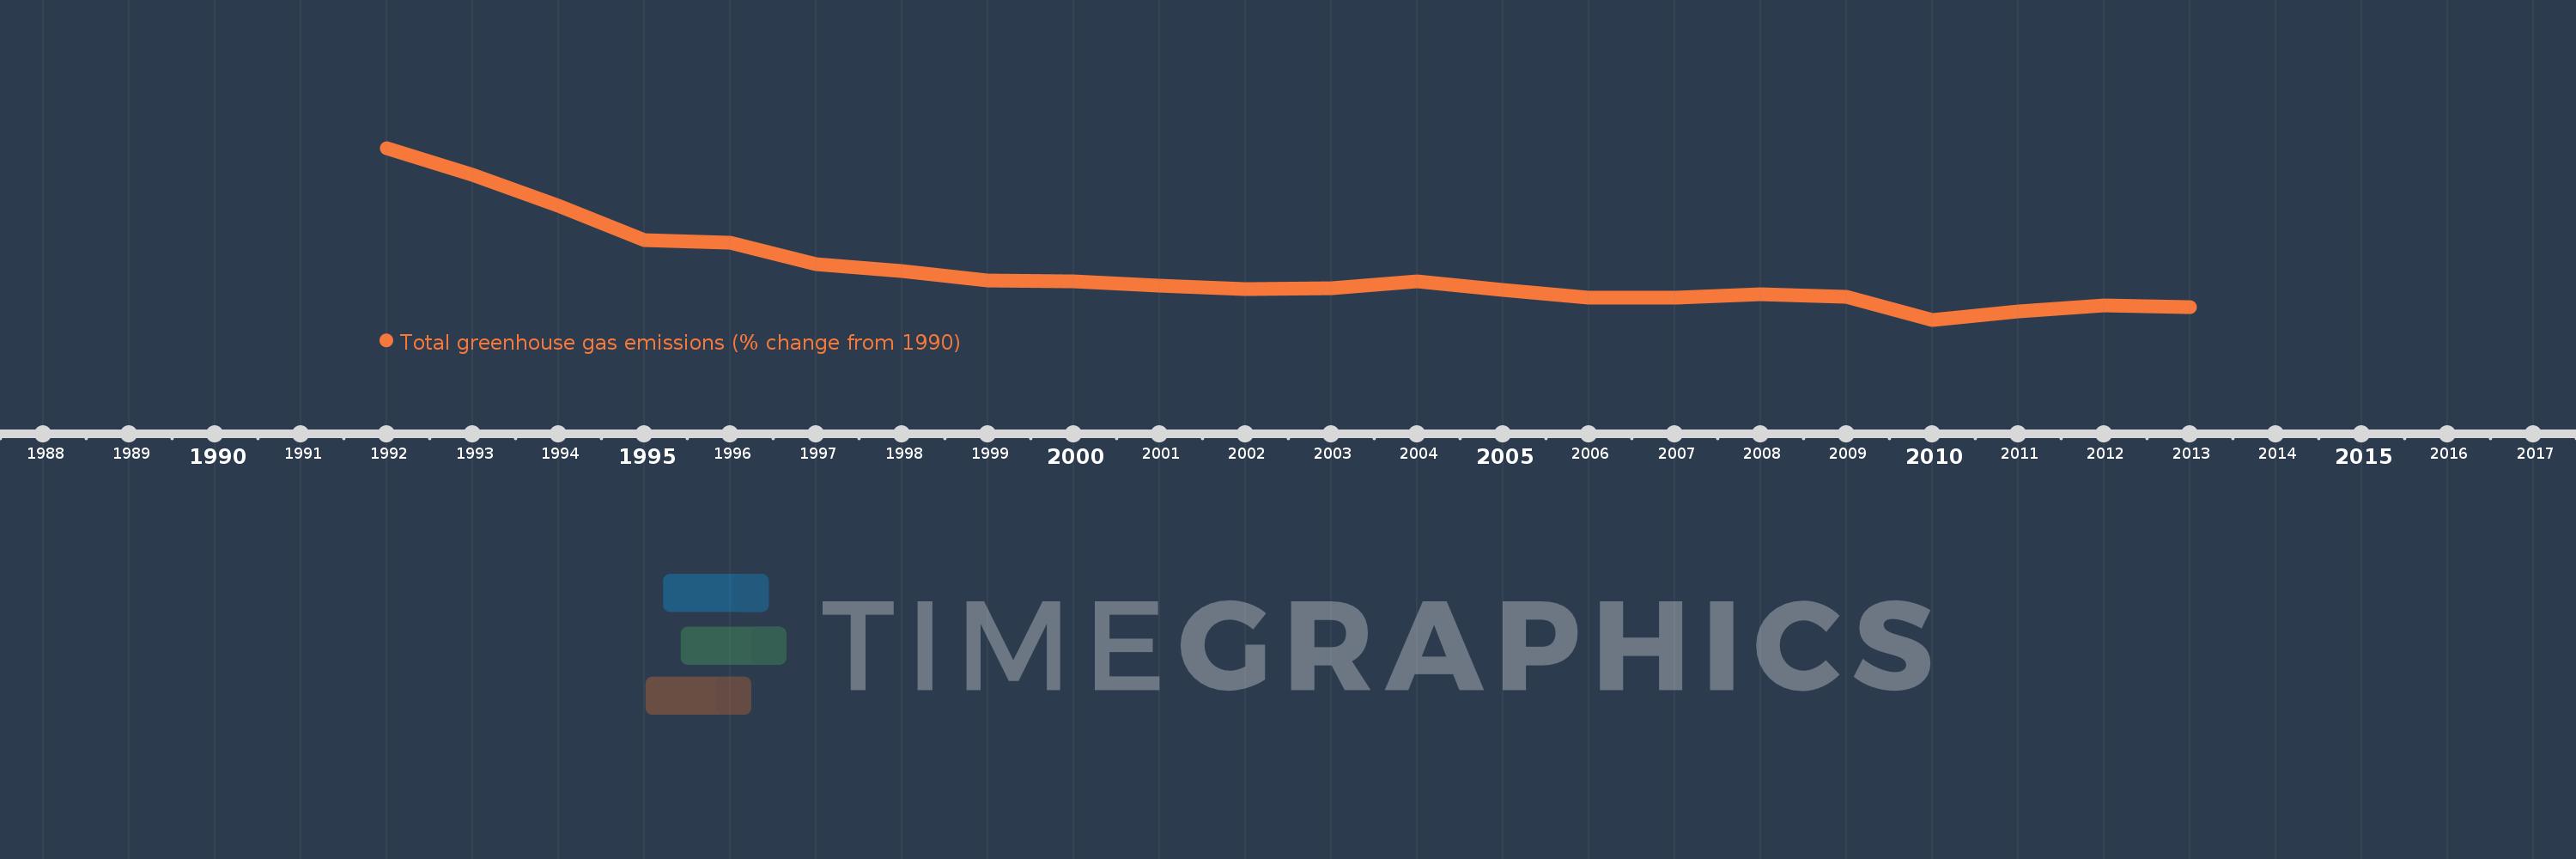
This timeline shows a graph from 1992 to 2013 of Ukraine. No data until 1991. Number of actual observations by date: 22.
Source name:
World Development Indicators
Source organization:
World Bank staff estimates from original source: European Commission, Joint Research Centre (JRC)/Netherlands Environmental Assessment Agency (PBL). Emission Database for Global Atmospheric Research (EDGAR): http://edgar.jrc.ec.europa.eu/.
Categories, topics:
Climate Change, Environment
Last updated:
apr 23, 2017
Indicators value changes by year
Meaning:
-46.196
Minimum:
-61.458
jan 1, 2010
Maximum:
-7.125
jan 1, 1992
At the date of observation
Value
Absolute change
Change from the previous value
jan 1, 1992
-7.125
-7.125
0.0%
jan 1, 1993
-15.618
-8.493
119.2%
jan 1, 1994
-25.298
-9.68
61.98%
jan 1, 1995
-36.347
-11.05
43.68%
jan 1, 1996
-37.213
-0.866
2.38%
jan 1, 1997
-43.987
-6.774
18.2%
jan 1, 1998
-46.014
-2.027
4.61%
jan 1, 1999
-49.063
-3.049
6.63%
jan 1, 2000
-49.288
-0.225
0.46%
jan 1, 2001
-50.677
-1.389
2.82%
jan 1, 2002
-51.741
-1.064
2.1%
jan 1, 2003
-51.452
+0.289
-0.56%
jan 1, 2004
-49.184
+2.268
-4.41%
jan 1, 2005
-52.035
-2.851
5.8%
jan 1, 2006
-54.395
-2.36
4.54%
jan 1, 2007
-54.609
-0.214
0.39%
jan 1, 2008
-53.395
+1.214
-2.22%
jan 1, 2009
-54.17
-0.775
1.45%
jan 1, 2010
-61.458
-7.288
13.45%
jan 1, 2011
-58.757
+2.701
-4.39%
jan 1, 2012
-56.976
+1.781
-3.03%
jan 1, 2013
-57.518
-0.542
0.95%
Ranking of countries by current statistics by years