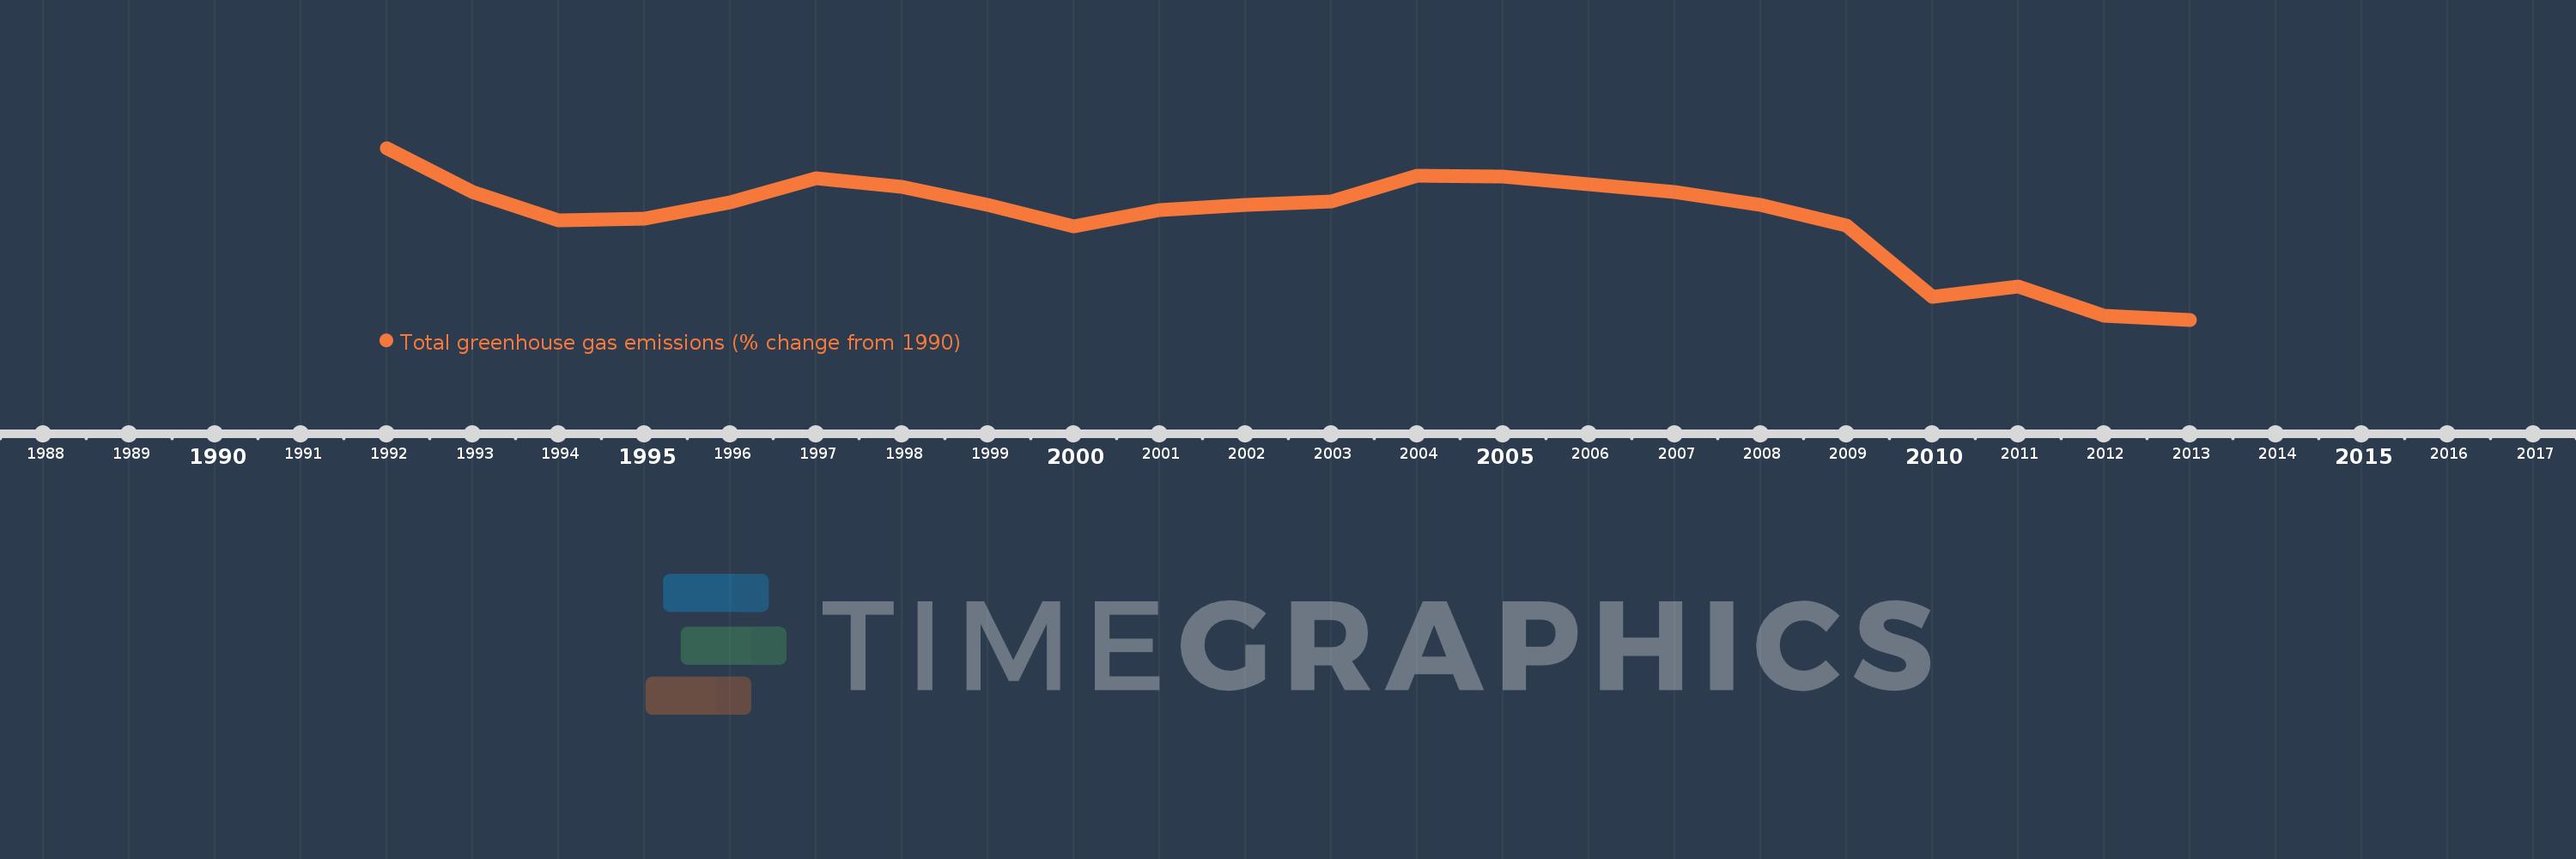
This timeline shows a graph from 1992 to 2013 of Euro area. No data until 1991. Number of actual observations by date: 22.
Source name:
World Development Indicators
Source organization:
World Bank staff estimates from original source: European Commission, Joint Research Centre (JRC)/Netherlands Environmental Assessment Agency (PBL). Emission Database for Global Atmospheric Research (EDGAR): http://edgar.jrc.ec.europa.eu/.
Categories, topics:
Climate Change, Environment
Last updated:
apr 23, 2017
Indicators value changes by year
Meaning:
-5.017
Minimum:
-12.411
jan 1, 2013
Maximum:
-0.063
jan 1, 1992
At the date of observation
Value
Absolute change
Change from the previous value
jan 1, 1992
-0.063
-0.063
0.0%
jan 1, 1993
-3.236
-3.172
5.0K%
jan 1, 1994
-5.243
-2.007
62.01%
jan 1, 1995
-5.125
+0.118
-2.24%
jan 1, 1996
-3.993
+1.132
-22.09%
jan 1, 1997
-2.252
+1.741
-43.59%
jan 1, 1998
-2.886
-0.634
28.14%
jan 1, 1999
-4.159
-1.273
44.1%
jan 1, 2000
-5.672
-1.512
36.36%
jan 1, 2001
-4.533
+1.138
-20.07%
jan 1, 2002
-4.182
+0.351
-7.74%
jan 1, 2003
-3.922
+0.26
-6.22%
jan 1, 2004
-2.031
+1.891
-48.22%
jan 1, 2005
-2.125
-0.094
4.61%
jan 1, 2006
-2.644
-0.519
24.45%
jan 1, 2007
-3.259
-0.615
23.28%
jan 1, 2008
-4.161
-0.902
27.67%
jan 1, 2009
-5.627
-1.466
35.22%
jan 1, 2010
-10.741
-5.114
90.89%
jan 1, 2011
-10.001
+0.74
-6.89%
jan 1, 2012
-12.096
-2.095
20.95%
jan 1, 2013
-12.411
-0.315
2.61%
Ranking of countries by current statistics by years