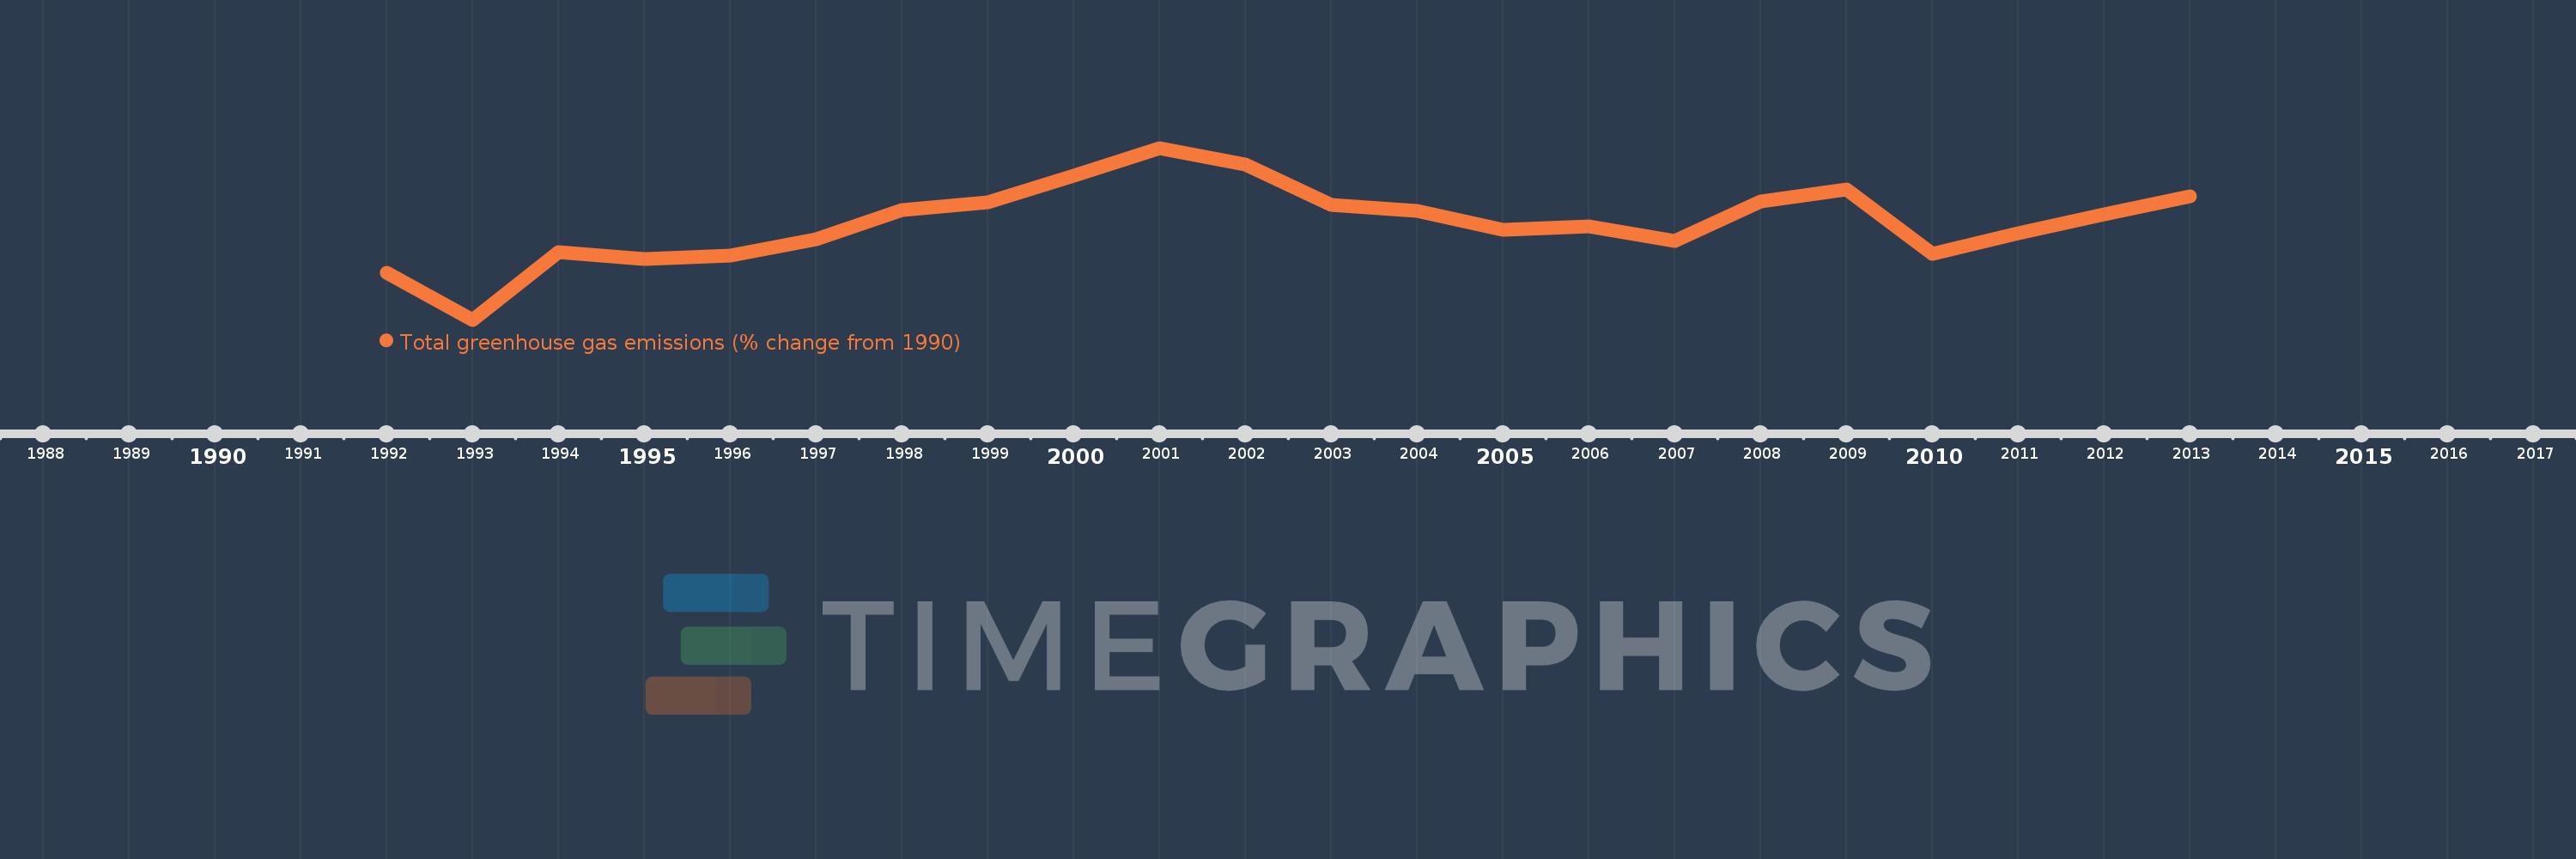
This timeline shows a graph from 1992 to 2013 of Vanuatu. No data until 1991. Number of actual observations by date: 22.
Source name:
World Development Indicators
Source organization:
World Bank staff estimates from original source: European Commission, Joint Research Centre (JRC)/Netherlands Environmental Assessment Agency (PBL). Emission Database for Global Atmospheric Research (EDGAR): http://edgar.jrc.ec.europa.eu/.
Categories, topics:
Climate Change, Environment
Last updated:
apr 23, 2017
Indicators value changes by year
Meaning:
0.934
Minimum:
-6.598
jan 1, 1993
Maximum:
6.759
jan 1, 2001
At the date of observation
Value
Absolute change
Change from the previous value
jan 1, 1992
-2.958
-2.958
0.0%
jan 1, 1993
-6.598
-3.641
123.09%
jan 1, 1994
-1.309
+5.289
-80.16%
jan 1, 1995
-1.892
-0.582
44.48%
jan 1, 1996
-1.615
+0.276
-14.61%
jan 1, 1997
-0.349
+1.266
-78.37%
jan 1, 1998
1.911
+2.26
-646.89%
jan 1, 1999
2.542
+0.631
33.03%
jan 1, 2000
4.587
+2.045
80.47%
jan 1, 2001
6.759
+2.171
47.34%
jan 1, 2002
5.481
-1.278
-18.91%
jan 1, 2003
2.35
-3.131
-57.13%
jan 1, 2004
1.844
-0.506
-21.53%
jan 1, 2005
0.392
-1.452
-78.74%
jan 1, 2006
0.643
+0.251
63.97%
jan 1, 2007
-0.478
-1.121
-174.43%
jan 1, 2008
2.574
+3.052
-638.02%
jan 1, 2009
3.529
+0.955
37.1%
jan 1, 2010
-1.498
-5.027
-142.47%
jan 1, 2011
0.095
+1.594
-106.37%
jan 1, 2012
1.569
+1.474
1.54K%
jan 1, 2013
2.97
+1.4
89.22%
Ranking of countries by current statistics by years