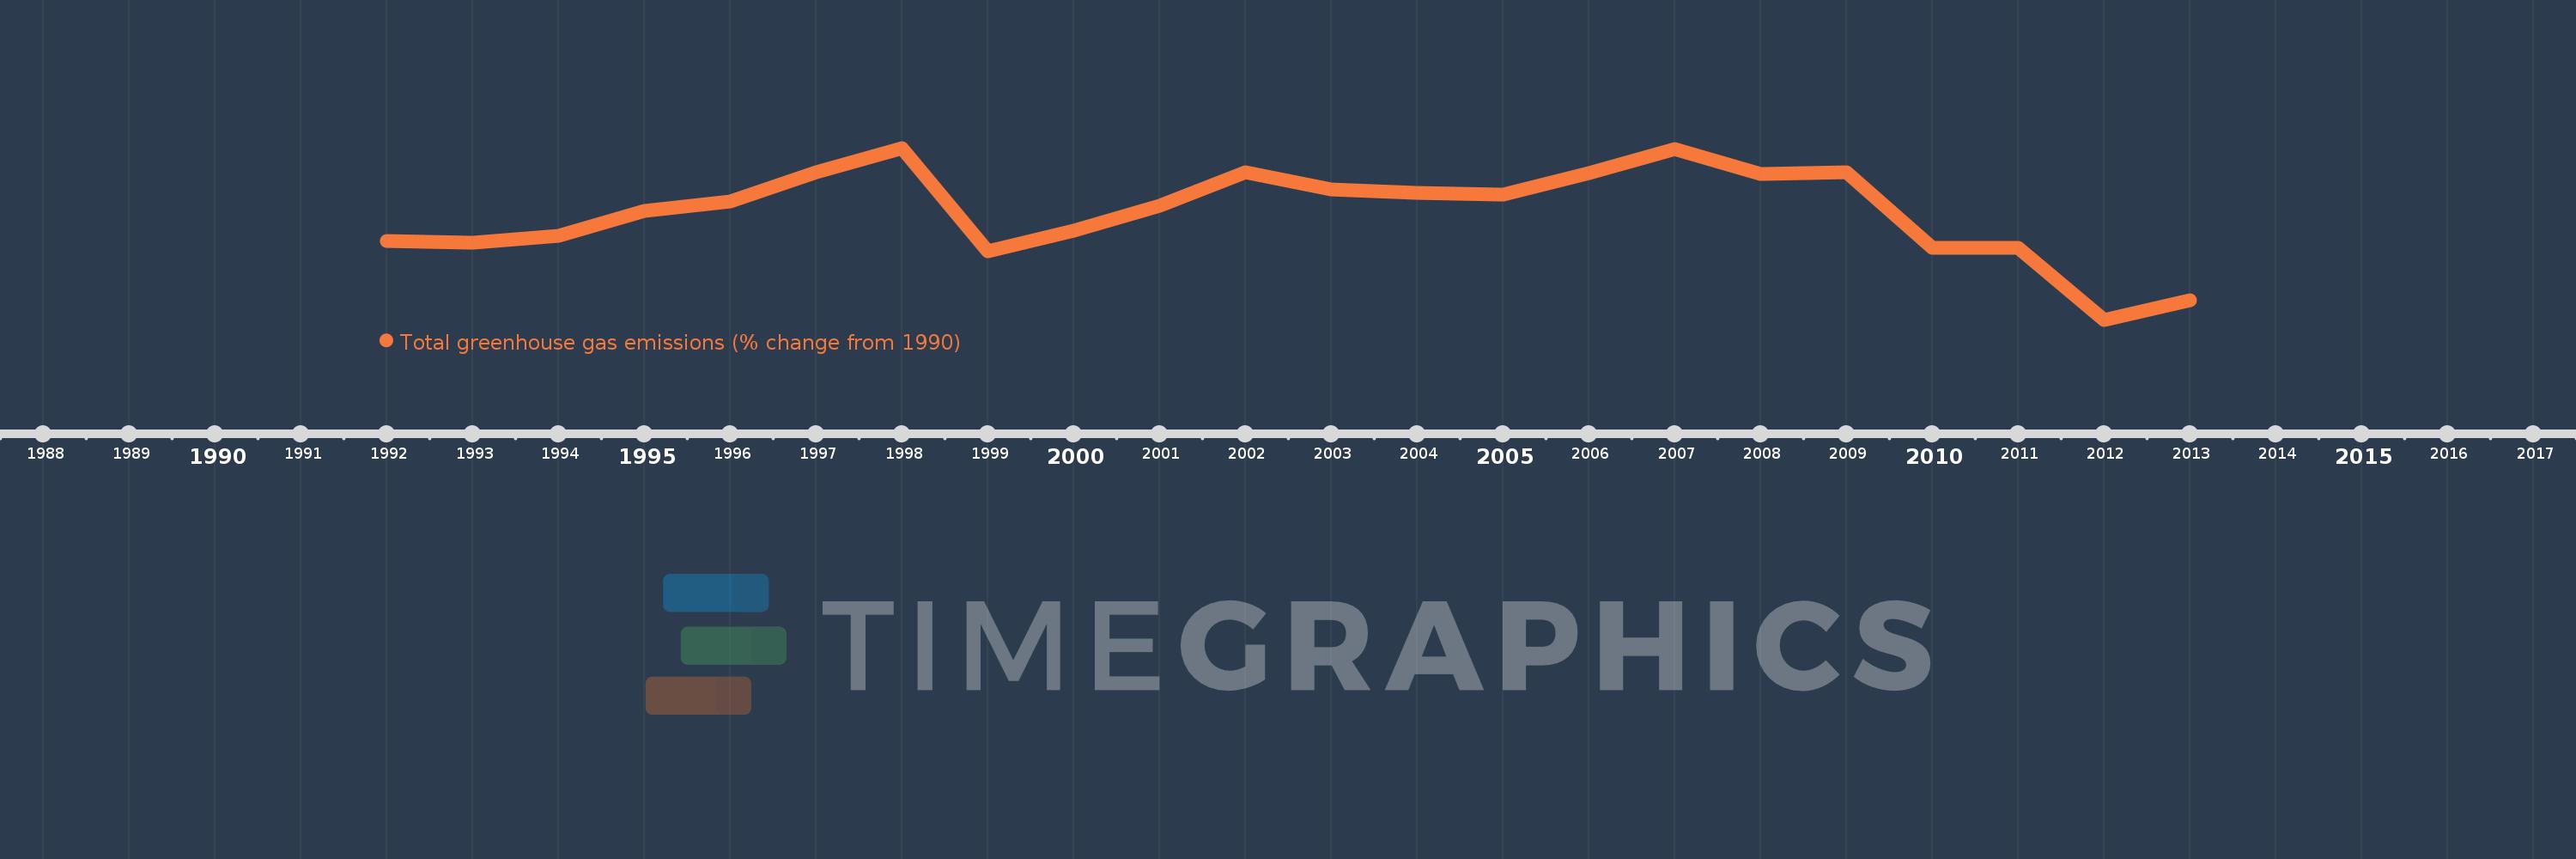
This timeline shows a graph from 1992 to 2013 of Ireland. No data until 1991. Number of actual observations by date: 22.
Source name:
World Development Indicators
Source organization:
World Bank staff estimates from original source: European Commission, Joint Research Centre (JRC)/Netherlands Environmental Assessment Agency (PBL). Emission Database for Global Atmospheric Research (EDGAR): http://edgar.jrc.ec.europa.eu/.
Categories, topics:
Climate Change, Environment
Last updated:
apr 23, 2017
Indicators value changes by year
Meaning:
3.259
Minimum:
-6.58
jan 1, 2012
Maximum:
9.166
jan 1, 1998
At the date of observation
Value
Absolute change
Change from the previous value
jan 1, 1992
0.605
+0.605
0.0%
jan 1, 1993
0.506
-0.099
-16.43%
jan 1, 1994
1.151
+0.645
127.58%
jan 1, 1995
3.365
+2.214
192.28%
jan 1, 1996
4.255
+0.89
26.46%
jan 1, 1997
6.966
+2.711
63.71%
jan 1, 1998
9.166
+2.199
31.57%
jan 1, 1999
-0.299
-9.464
-103.26%
jan 1, 2000
1.602
+1.9
-636.55%
jan 1, 2001
3.904
+2.302
143.73%
jan 1, 2002
6.969
+3.066
78.54%
jan 1, 2003
5.354
-1.615
-23.18%
jan 1, 2004
5.016
-0.339
-6.33%
jan 1, 2005
4.859
-0.156
-3.12%
jan 1, 2006
6.858
+1.998
41.13%
jan 1, 2007
9.027
+2.169
31.63%
jan 1, 2008
6.785
-2.242
-24.84%
jan 1, 2009
6.937
+0.152
2.24%
jan 1, 2010
0.046
-6.891
-99.34%
jan 1, 2011
0.012
-0.033
-73.04%
jan 1, 2012
-6.58
-6.592
-53.68K%
jan 1, 2013
-4.803
+1.776
-27.0%
Ranking of countries by current statistics by years