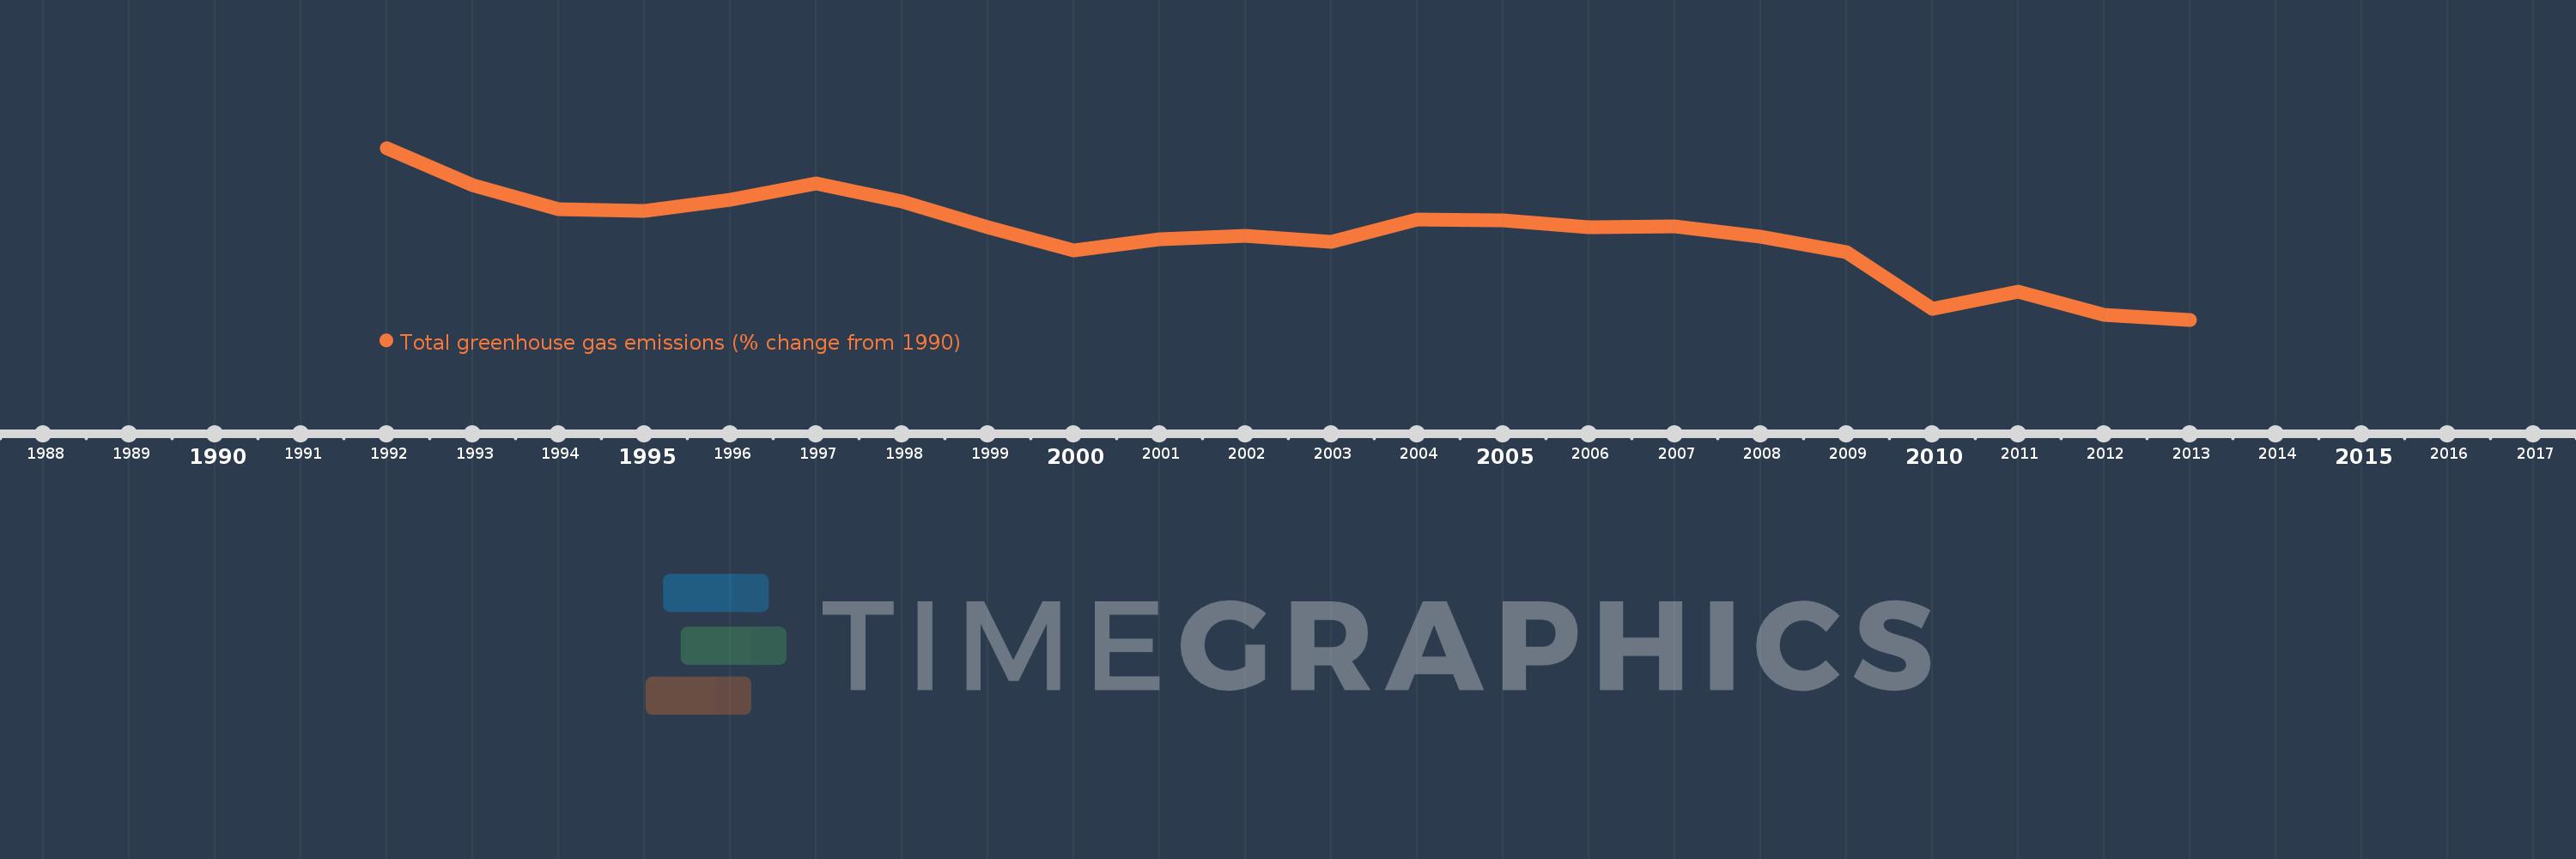
This timeline shows a graph from 1992 to 2013 of European Union. No data until 1991. Number of actual observations by date: 22.
Source name:
World Development Indicators
Source organization:
World Bank staff estimates from original source: European Commission, Joint Research Centre (JRC)/Netherlands Environmental Assessment Agency (PBL). Emission Database for Global Atmospheric Research (EDGAR): http://edgar.jrc.ec.europa.eu/.
Categories, topics:
Climate Change, Environment
Last updated:
apr 23, 2017
Indicators value changes by year
Meaning:
-9.579
Minimum:
-17.402
jan 1, 2013
Maximum:
-1.708
jan 1, 1992
At the date of observation
Value
Absolute change
Change from the previous value
jan 1, 1992
-1.708
-1.708
0.0%
jan 1, 1993
-5.144
-3.437
201.25%
jan 1, 1994
-7.303
-2.159
41.97%
jan 1, 1995
-7.473
-0.169
2.32%
jan 1, 1996
-6.477
+0.996
-13.33%
jan 1, 1997
-4.933
+1.544
-23.84%
jan 1, 1998
-6.567
-1.635
33.14%
jan 1, 1999
-8.952
-2.384
36.31%
jan 1, 2000
-11.08
-2.128
23.77%
jan 1, 2001
-10.042
+1.038
-9.37%
jan 1, 2002
-9.705
+0.337
-3.36%
jan 1, 2003
-10.305
-0.601
6.19%
jan 1, 2004
-8.239
+2.067
-20.05%
jan 1, 2005
-8.321
-0.082
1.0%
jan 1, 2006
-8.938
-0.617
7.41%
jan 1, 2007
-8.895
+0.043
-0.48%
jan 1, 2008
-9.82
-0.925
10.4%
jan 1, 2009
-11.226
-1.407
14.33%
jan 1, 2010
-16.406
-5.18
46.14%
jan 1, 2011
-14.851
+1.556
-9.48%
jan 1, 2012
-16.943
-2.093
14.09%
jan 1, 2013
-17.402
-0.458
2.7%
Ranking of countries by current statistics by years