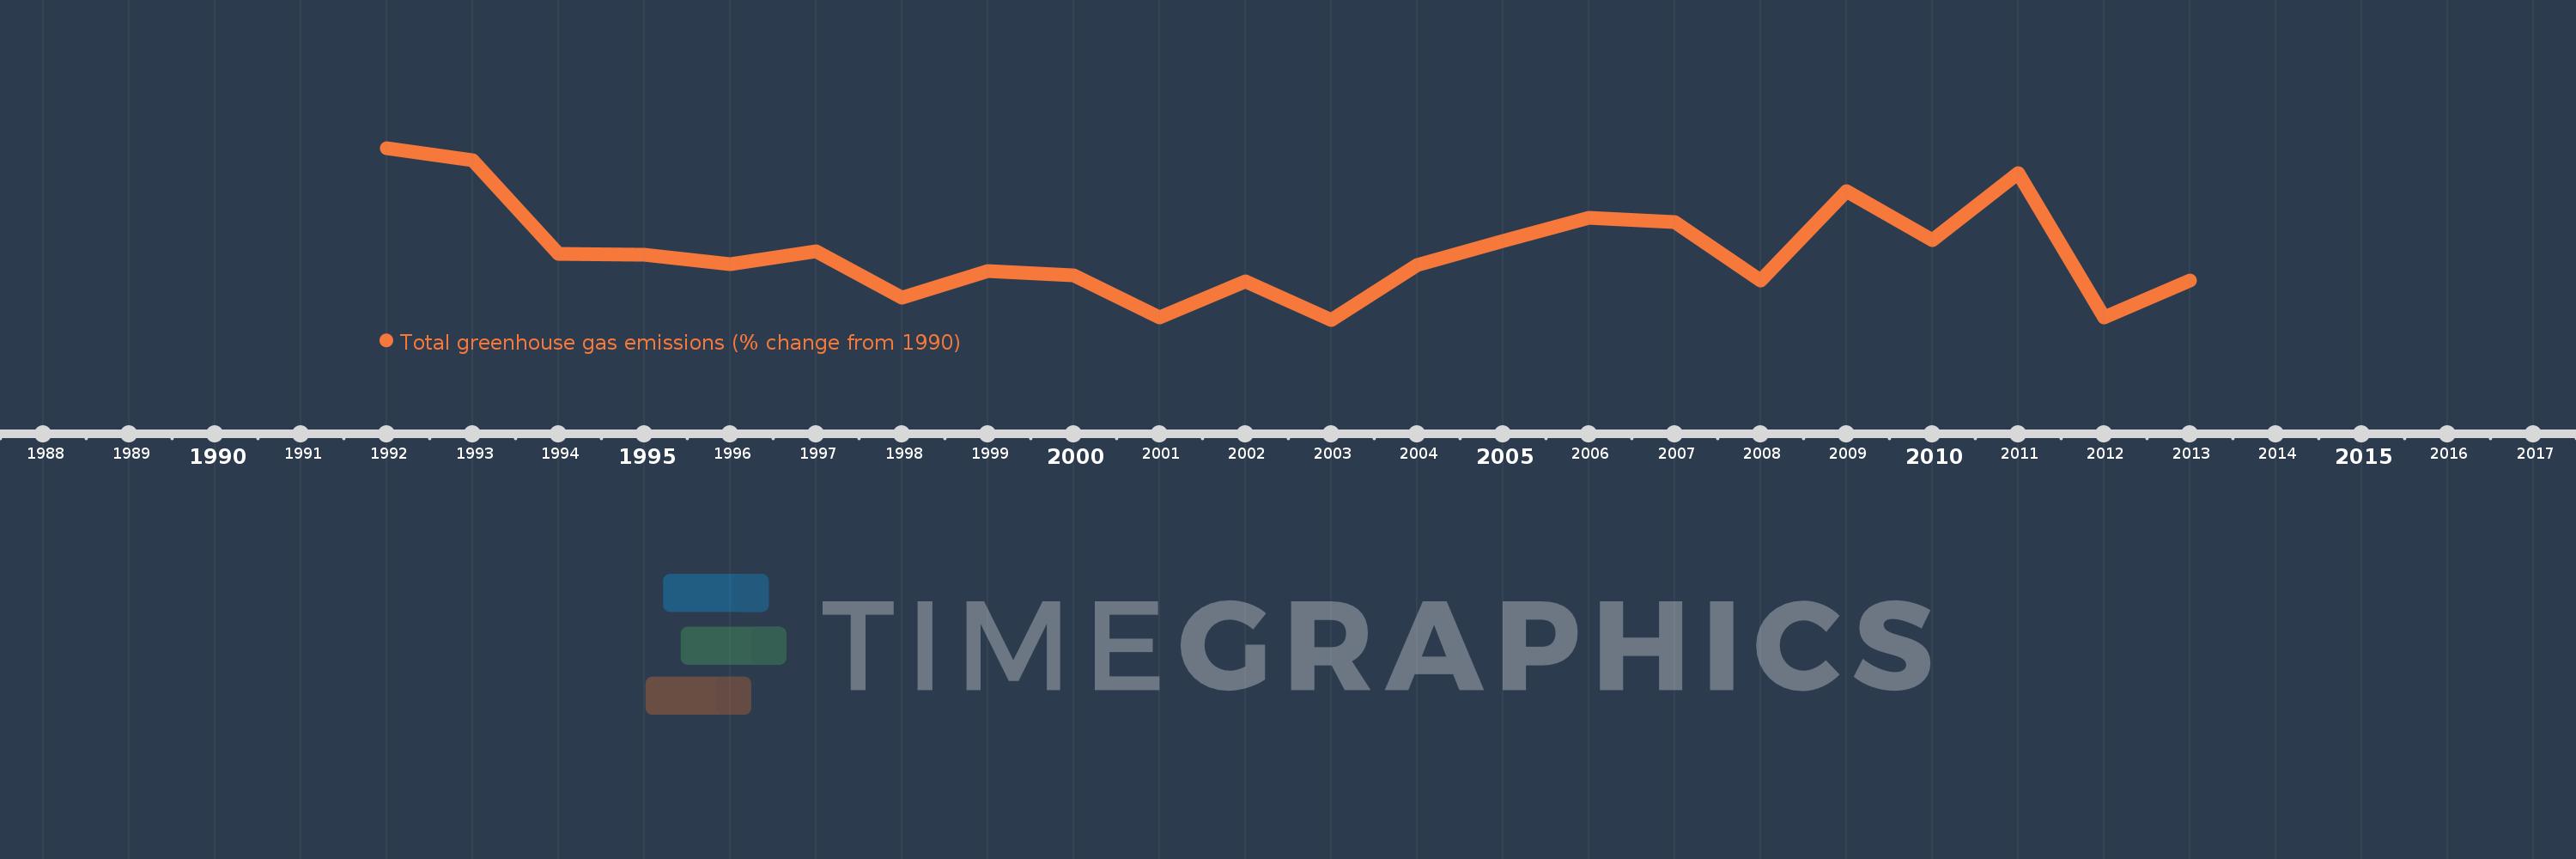
This timeline shows a graph from 1992 to 2013 of Switzerland. No data until 1991. Number of actual observations by date: 22.
Source name:
World Development Indicators
Source organization:
World Bank staff estimates from original source: European Commission, Joint Research Centre (JRC)/Netherlands Environmental Assessment Agency (PBL). Emission Database for Global Atmospheric Research (EDGAR): http://edgar.jrc.ec.europa.eu/.
Categories, topics:
Climate Change, Environment
Last updated:
apr 23, 2017
Indicators value changes by year
Meaning:
-2.578
Minimum:
-6.023
jan 1, 2003
Maximum:
2.589
jan 1, 1992
At the date of observation
Value
Absolute change
Change from the previous value
jan 1, 1992
2.589
+2.589
0.0%
jan 1, 1993
1.972
-0.617
-23.83%
jan 1, 1994
-2.707
-4.679
-237.25%
jan 1, 1995
-2.761
-0.054
2.0%
jan 1, 1996
-3.22
-0.46
16.65%
jan 1, 1997
-2.61
+0.61
-18.95%
jan 1, 1998
-4.932
-2.322
88.95%
jan 1, 1999
-3.589
+1.343
-27.22%
jan 1, 2000
-3.8
-0.211
5.88%
jan 1, 2001
-5.906
-2.106
55.4%
jan 1, 2002
-4.111
+1.795
-30.39%
jan 1, 2003
-6.023
-1.911
46.5%
jan 1, 2004
-3.265
+2.758
-45.79%
jan 1, 2005
-2.077
+1.188
-36.38%
jan 1, 2006
-0.906
+1.171
-56.38%
jan 1, 2007
-1.12
-0.214
23.65%
jan 1, 2008
-4.045
-2.925
261.08%
jan 1, 2009
0.428
+4.473
-110.57%
jan 1, 2010
-2.035
-2.463
-576.1%
jan 1, 2011
1.348
+3.384
-166.25%
jan 1, 2012
-5.899
-7.248
-537.53%
jan 1, 2013
-4.053
+1.846
-31.3%
Ranking of countries by current statistics by years