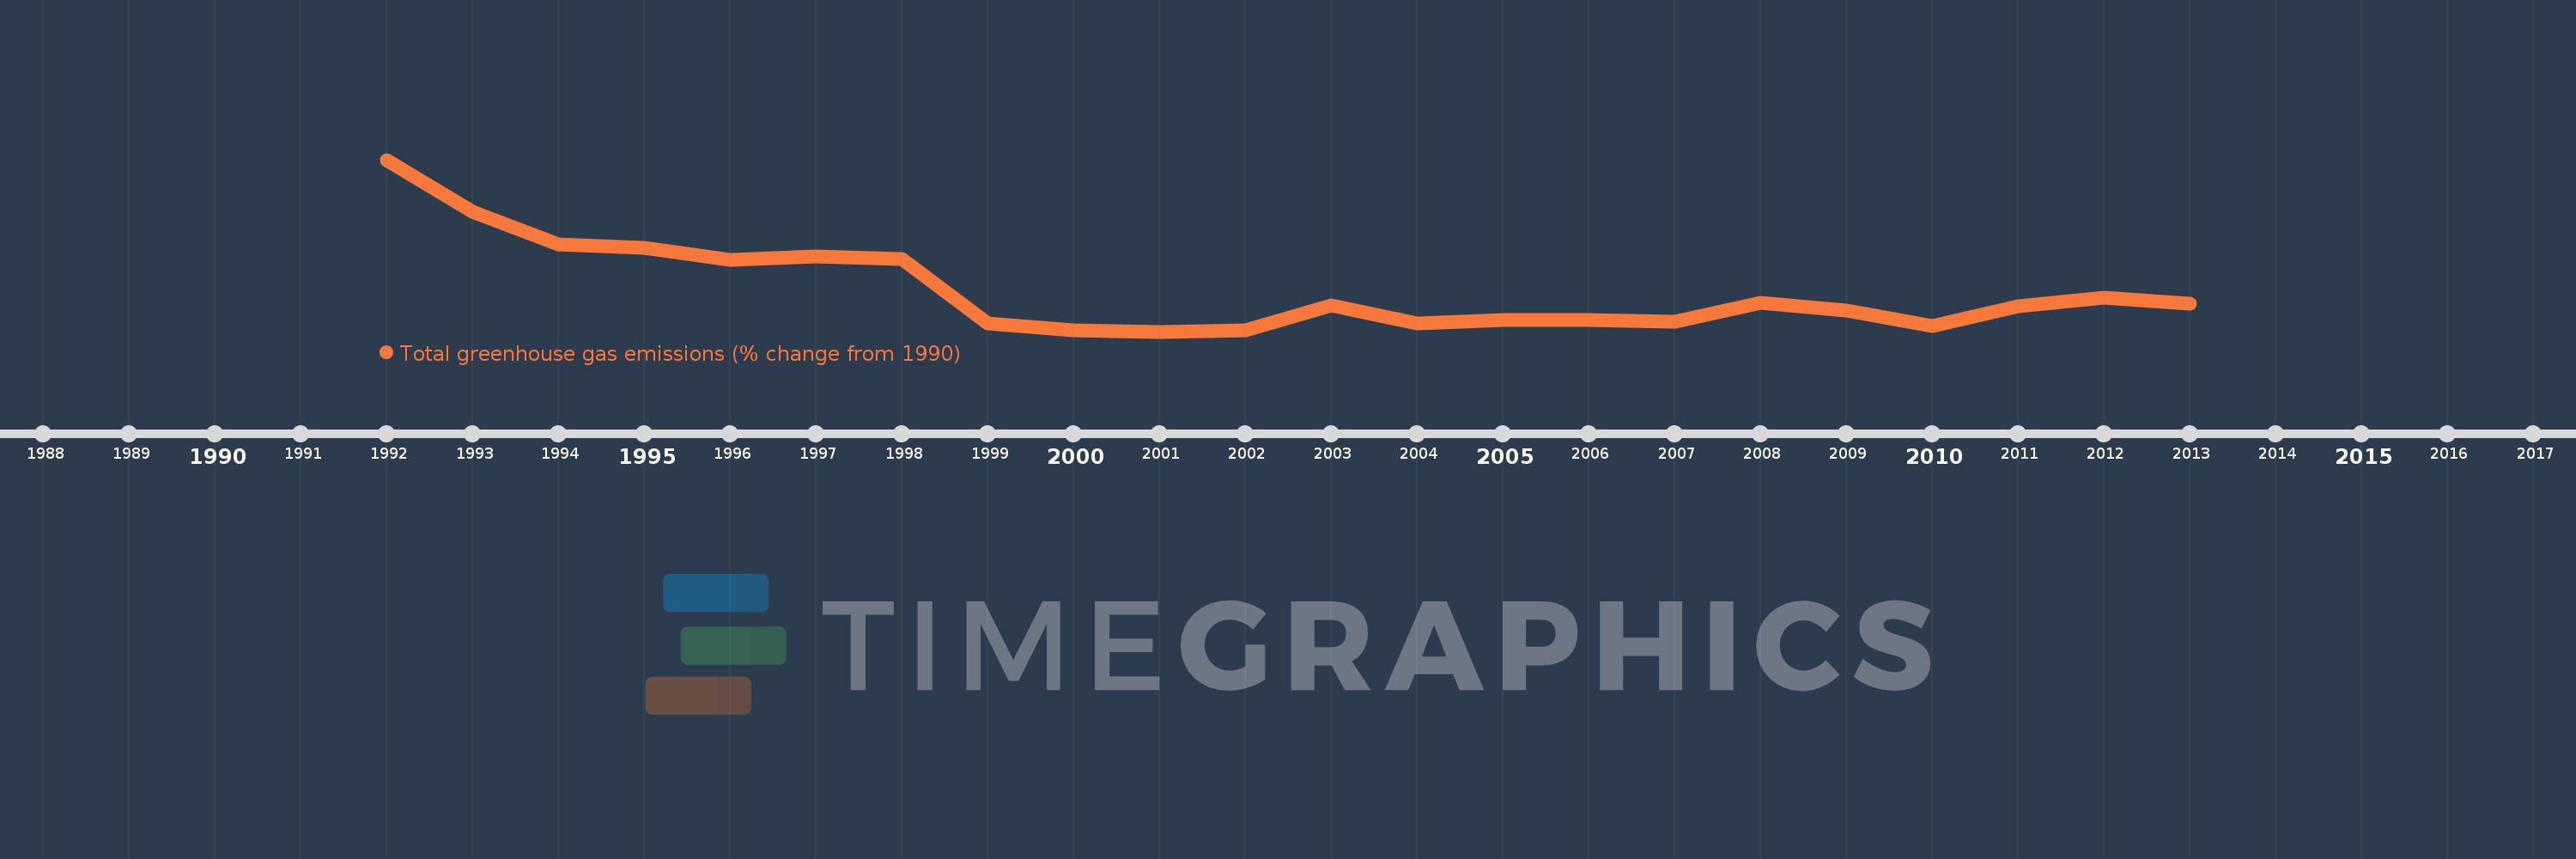
This timeline shows a graph from 1992 to 2013 of Estonia. No data until 1991. Number of actual observations by date: 22.
Source name:
World Development Indicators
Source organization:
World Bank staff estimates from original source: European Commission, Joint Research Centre (JRC)/Netherlands Environmental Assessment Agency (PBL). Emission Database for Global Atmospheric Research (EDGAR): http://edgar.jrc.ec.europa.eu/.
Categories, topics:
Climate Change, Environment
Last updated:
apr 23, 2017
Indicators value changes by year
Meaning:
-53.682
Minimum:
-68.149
jan 1, 2001
Maximum:
-7.636
jan 1, 1992
At the date of observation
Value
Absolute change
Change from the previous value
jan 1, 1992
-7.636
-7.636
0.0%
jan 1, 1993
-26.041
-18.405
241.03%
jan 1, 1994
-37.486
-11.445
43.95%
jan 1, 1995
-38.596
-1.111
2.96%
jan 1, 1996
-42.759
-4.162
10.78%
jan 1, 1997
-41.556
+1.203
-2.81%
jan 1, 1998
-42.435
-0.878
2.11%
jan 1, 1999
-65.32
-22.885
53.93%
jan 1, 2000
-67.557
-2.238
3.43%
jan 1, 2001
-68.149
-0.592
0.88%
jan 1, 2002
-67.842
+0.307
-0.45%
jan 1, 2003
-58.852
+8.99
-13.25%
jan 1, 2004
-65.136
-6.284
10.68%
jan 1, 2005
-64.106
+1.03
-1.58%
jan 1, 2006
-64.054
+0.052
-0.08%
jan 1, 2007
-64.816
-0.762
1.19%
jan 1, 2008
-57.869
+6.947
-10.72%
jan 1, 2009
-60.794
-2.925
5.05%
jan 1, 2010
-66.273
-5.478
9.01%
jan 1, 2011
-59.189
+7.083
-10.69%
jan 1, 2012
-56.3
+2.889
-4.88%
jan 1, 2013
-58.247
-1.947
3.46%
Ranking of countries by current statistics by years