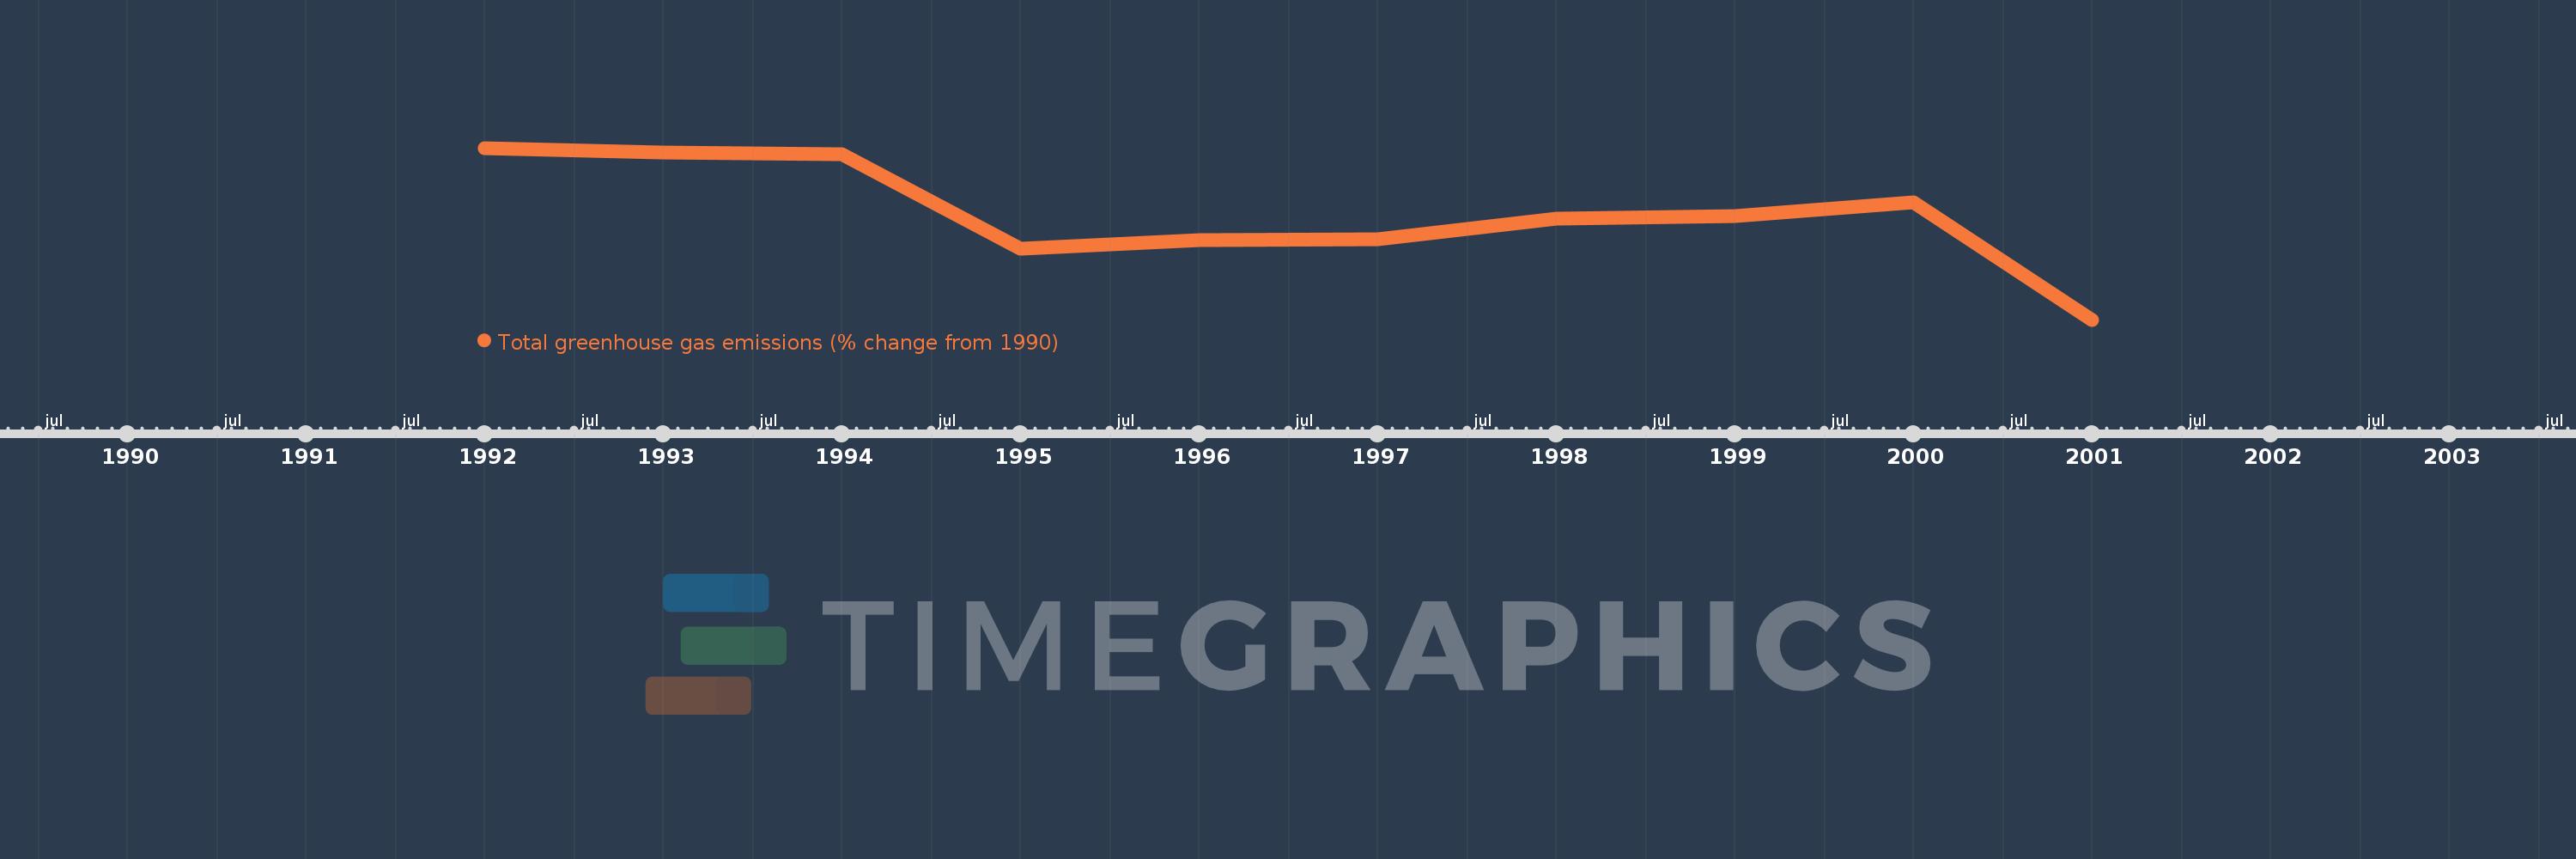
This timeline shows a graph from 1992 to 2001 of French Polynesia. No data until 1991. Number of actual observations by date: 10.
Source name:
World Development Indicators
Source organization:
World Bank staff estimates from original source: European Commission, Joint Research Centre (JRC)/Netherlands Environmental Assessment Agency (PBL). Emission Database for Global Atmospheric Research (EDGAR): http://edgar.jrc.ec.europa.eu/.
Categories, topics:
Climate Change, Environment
Last updated:
apr 23, 2017
Indicators value changes by year
Meaning:
-18.005
Minimum:
-39.86
jan 1, 2001
Maximum:
-4.36
jan 1, 1992
At the date of observation
Value
Absolute change
Change from the previous value
jan 1, 1992
-4.36
-4.36
0.0%
jan 1, 1993
-5.303
-0.942
21.6%
jan 1, 1994
-5.671
-0.369
6.95%
jan 1, 1995
-25.19
-19.519
344.17%
jan 1, 1996
-23.359
+1.832
-7.27%
jan 1, 1997
-23.271
+0.088
-0.38%
jan 1, 1998
-19.046
+4.225
-18.16%
jan 1, 1999
-18.418
+0.628
-3.3%
jan 1, 2000
-15.572
+2.845
-15.45%
jan 1, 2001
-39.86
-24.288
155.97%
Ranking of countries by current statistics by years