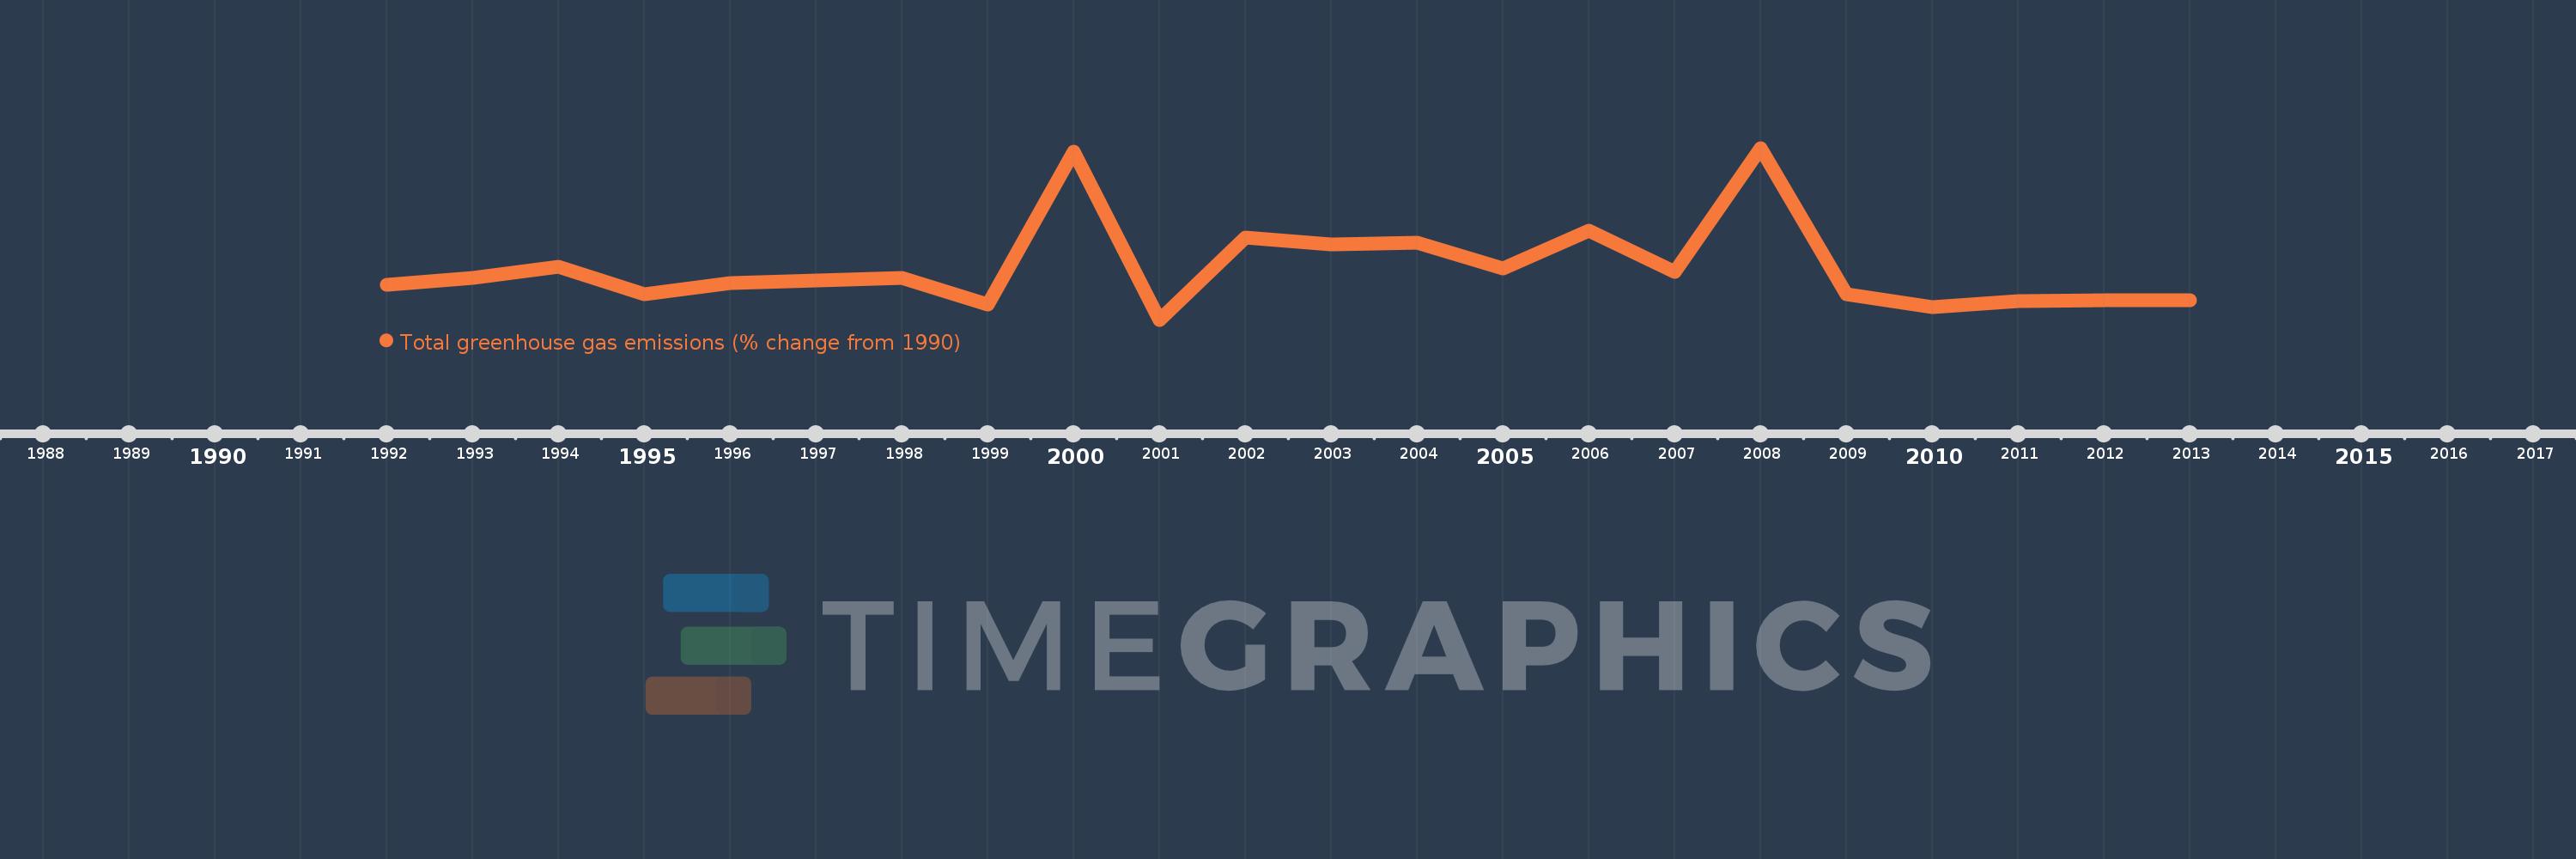
This timeline shows a graph from 1992 to 2013 of Paraguay. No data until 1991. Number of actual observations by date: 22.
Source name:
World Development Indicators
Source organization:
World Bank staff estimates from original source: European Commission, Joint Research Centre (JRC)/Netherlands Environmental Assessment Agency (PBL). Emission Database for Global Atmospheric Research (EDGAR): http://edgar.jrc.ec.europa.eu/.
Categories, topics:
Climate Change, Environment
Last updated:
apr 23, 2017
Indicators value changes by year
Meaning:
8.933
Minimum:
-38.215
jan 1, 2001
Maximum:
117.089
jan 1, 2008
At the date of observation
Value
Absolute change
Change from the previous value
jan 1, 1992
-6.624
-6.624
0.0%
jan 1, 1993
-0.255
+6.369
-96.15%
jan 1, 1994
10.018
+10.272
-4.03K%
jan 1, 1995
-14.841
-24.858
-248.15%
jan 1, 1996
-5.115
+9.726
-65.53%
jan 1, 1997
-2.366
+2.749
-53.74%
jan 1, 1998
-0.697
+1.669
-70.55%
jan 1, 1999
-24.677
-23.98
3.44K%
jan 1, 2000
113.996
+138.673
-561.96%
jan 1, 2001
-38.215
-152.211
-133.52%
jan 1, 2002
36.145
+74.36
-194.58%
jan 1, 2003
30.031
-6.114
-16.92%
jan 1, 2004
31.353
+1.323
4.4%
jan 1, 2005
8.171
-23.183
-73.94%
jan 1, 2006
42.162
+33.991
416.02%
jan 1, 2007
5.131
-37.031
-87.83%
jan 1, 2008
117.089
+111.958
2.18K%
jan 1, 2009
-15.261
-132.35
-113.03%
jan 1, 2010
-26.566
-11.305
74.08%
jan 1, 2011
-21.628
+4.938
-18.59%
jan 1, 2012
-20.974
+0.654
-3.02%
jan 1, 2013
-20.349
+0.625
-2.98%
Ranking of countries by current statistics by years