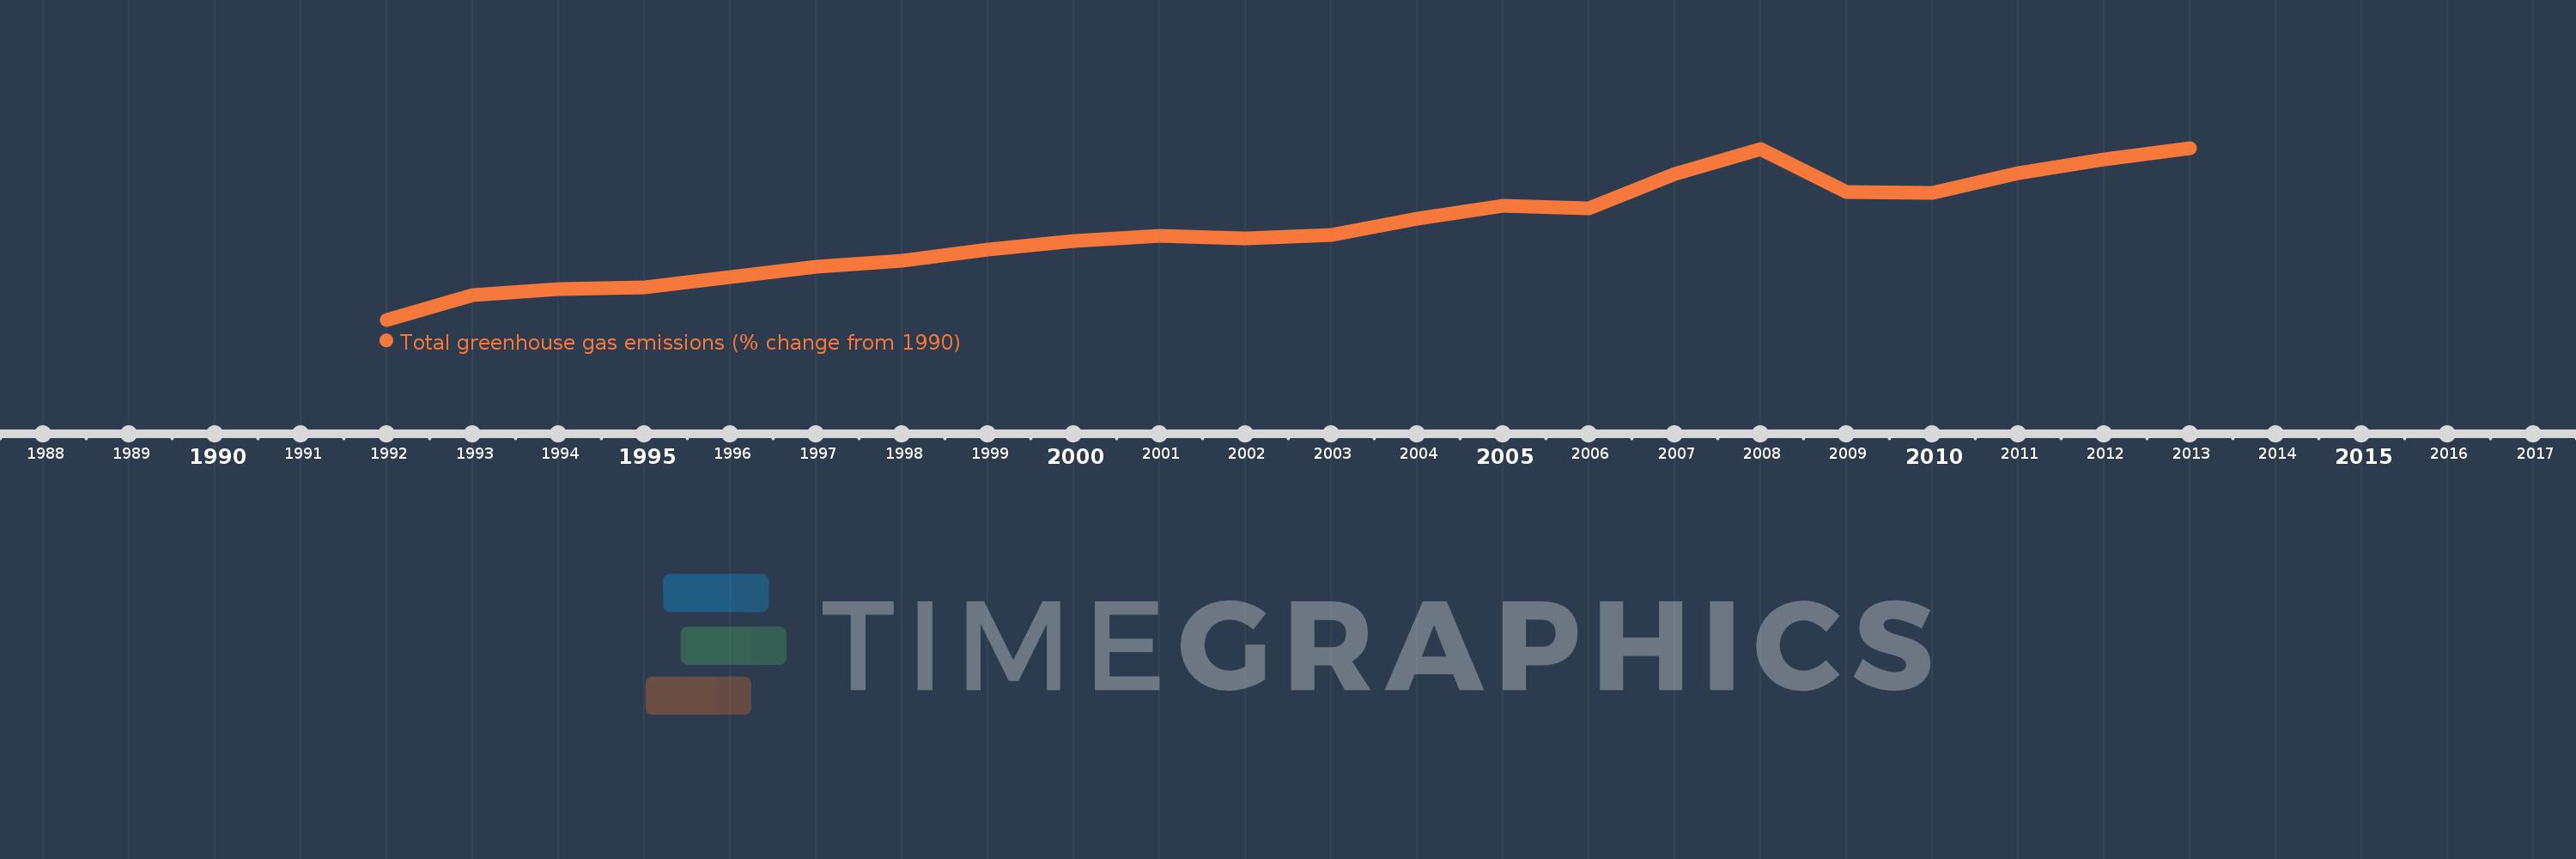
This timeline shows a graph from 1992 to 2013 of Jamaica. No data until 1991. Number of actual observations by date: 22.
Source name:
World Development Indicators
Source organization:
World Bank staff estimates from original source: European Commission, Joint Research Centre (JRC)/Netherlands Environmental Assessment Agency (PBL). Emission Database for Global Atmospheric Research (EDGAR): http://edgar.jrc.ec.europa.eu/.
Categories, topics:
Climate Change, Environment
Last updated:
apr 23, 2017
Indicators value changes by year
Meaning:
35.509
Minimum:
0.562
jan 1, 1992
Maximum:
66.047
jan 1, 2013
At the date of observation
Value
Absolute change
Change from the previous value
jan 1, 1992
0.562
+0.562
0.0%
jan 1, 1993
9.985
+9.423
1.68K%
jan 1, 1994
12.305
+2.32
23.24%
jan 1, 1995
12.904
+0.599
4.86%
jan 1, 1996
16.816
+3.912
30.32%
jan 1, 1997
20.695
+3.879
23.06%
jan 1, 1998
22.949
+2.255
10.9%
jan 1, 1999
27.42
+4.471
19.48%
jan 1, 2000
30.572
+3.151
11.49%
jan 1, 2001
32.677
+2.105
6.89%
jan 1, 2002
31.447
-1.229
-3.76%
jan 1, 2003
32.974
+1.526
4.85%
jan 1, 2004
39.057
+6.083
18.45%
jan 1, 2005
43.998
+4.941
12.65%
jan 1, 2006
42.876
-1.122
-2.55%
jan 1, 2007
56.129
+13.253
30.91%
jan 1, 2008
65.503
+9.374
16.7%
jan 1, 2009
49.289
-16.214
-24.75%
jan 1, 2010
48.984
-0.305
-0.62%
jan 1, 2011
56.469
+7.485
15.28%
jan 1, 2012
61.532
+5.063
8.97%
jan 1, 2013
66.047
+4.516
7.34%
Ranking of countries by current statistics by years