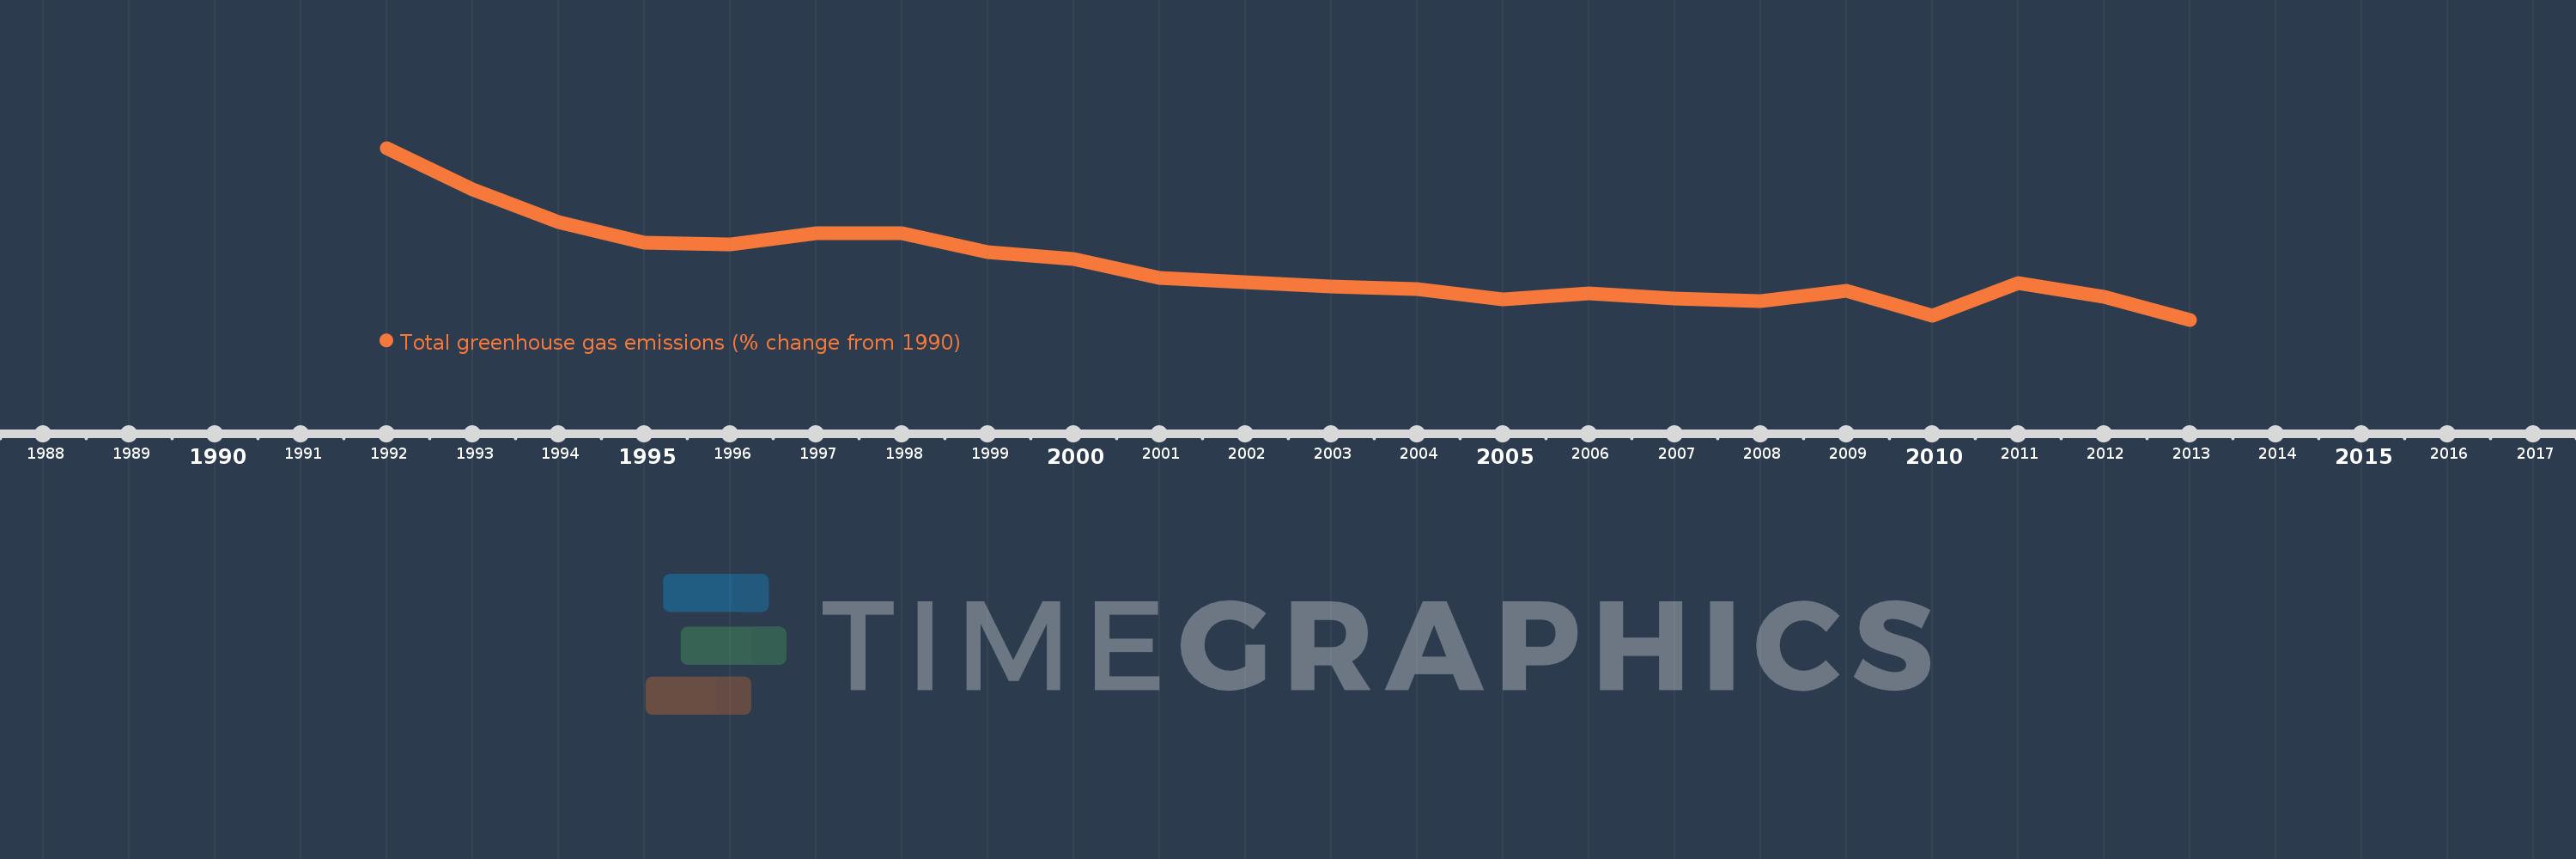
This timeline shows a graph from 1992 to 2013 of Slovak Republic. No data until 1991. Number of actual observations by date: 22.
Source name:
World Development Indicators
Source organization:
World Bank staff estimates from original source: European Commission, Joint Research Centre (JRC)/Netherlands Environmental Assessment Agency (PBL). Emission Database for Global Atmospheric Research (EDGAR): http://edgar.jrc.ec.europa.eu/.
Categories, topics:
Climate Change, Environment
Last updated:
apr 23, 2017
Indicators value changes by year
Meaning:
-28.572
Minimum:
-35.926
jan 1, 2013
Maximum:
-12.287
jan 1, 1992
At the date of observation
Value
Absolute change
Change from the previous value
jan 1, 1992
-12.287
-12.287
0.0%
jan 1, 1993
-17.977
-5.69
46.31%
jan 1, 1994
-22.467
-4.49
24.98%
jan 1, 1995
-25.273
-2.806
12.49%
jan 1, 1996
-25.515
-0.242
0.96%
jan 1, 1997
-24.078
+1.437
-5.63%
jan 1, 1998
-24.047
+0.03
-0.13%
jan 1, 1999
-26.62
-2.573
10.7%
jan 1, 2000
-27.622
-1.002
3.77%
jan 1, 2001
-30.225
-2.602
9.42%
jan 1, 2002
-30.725
-0.501
1.66%
jan 1, 2003
-31.379
-0.654
2.13%
jan 1, 2004
-31.726
-0.348
1.11%
jan 1, 2005
-33.081
-1.354
4.27%
jan 1, 2006
-32.249
+0.832
-2.52%
jan 1, 2007
-33.039
-0.791
2.45%
jan 1, 2008
-33.38
-0.34
1.03%
jan 1, 2009
-31.969
+1.411
-4.23%
jan 1, 2010
-35.343
-3.374
10.55%
jan 1, 2011
-30.845
+4.498
-12.73%
jan 1, 2012
-32.812
-1.967
6.38%
jan 1, 2013
-35.926
-3.114
9.49%
Ranking of countries by current statistics by years