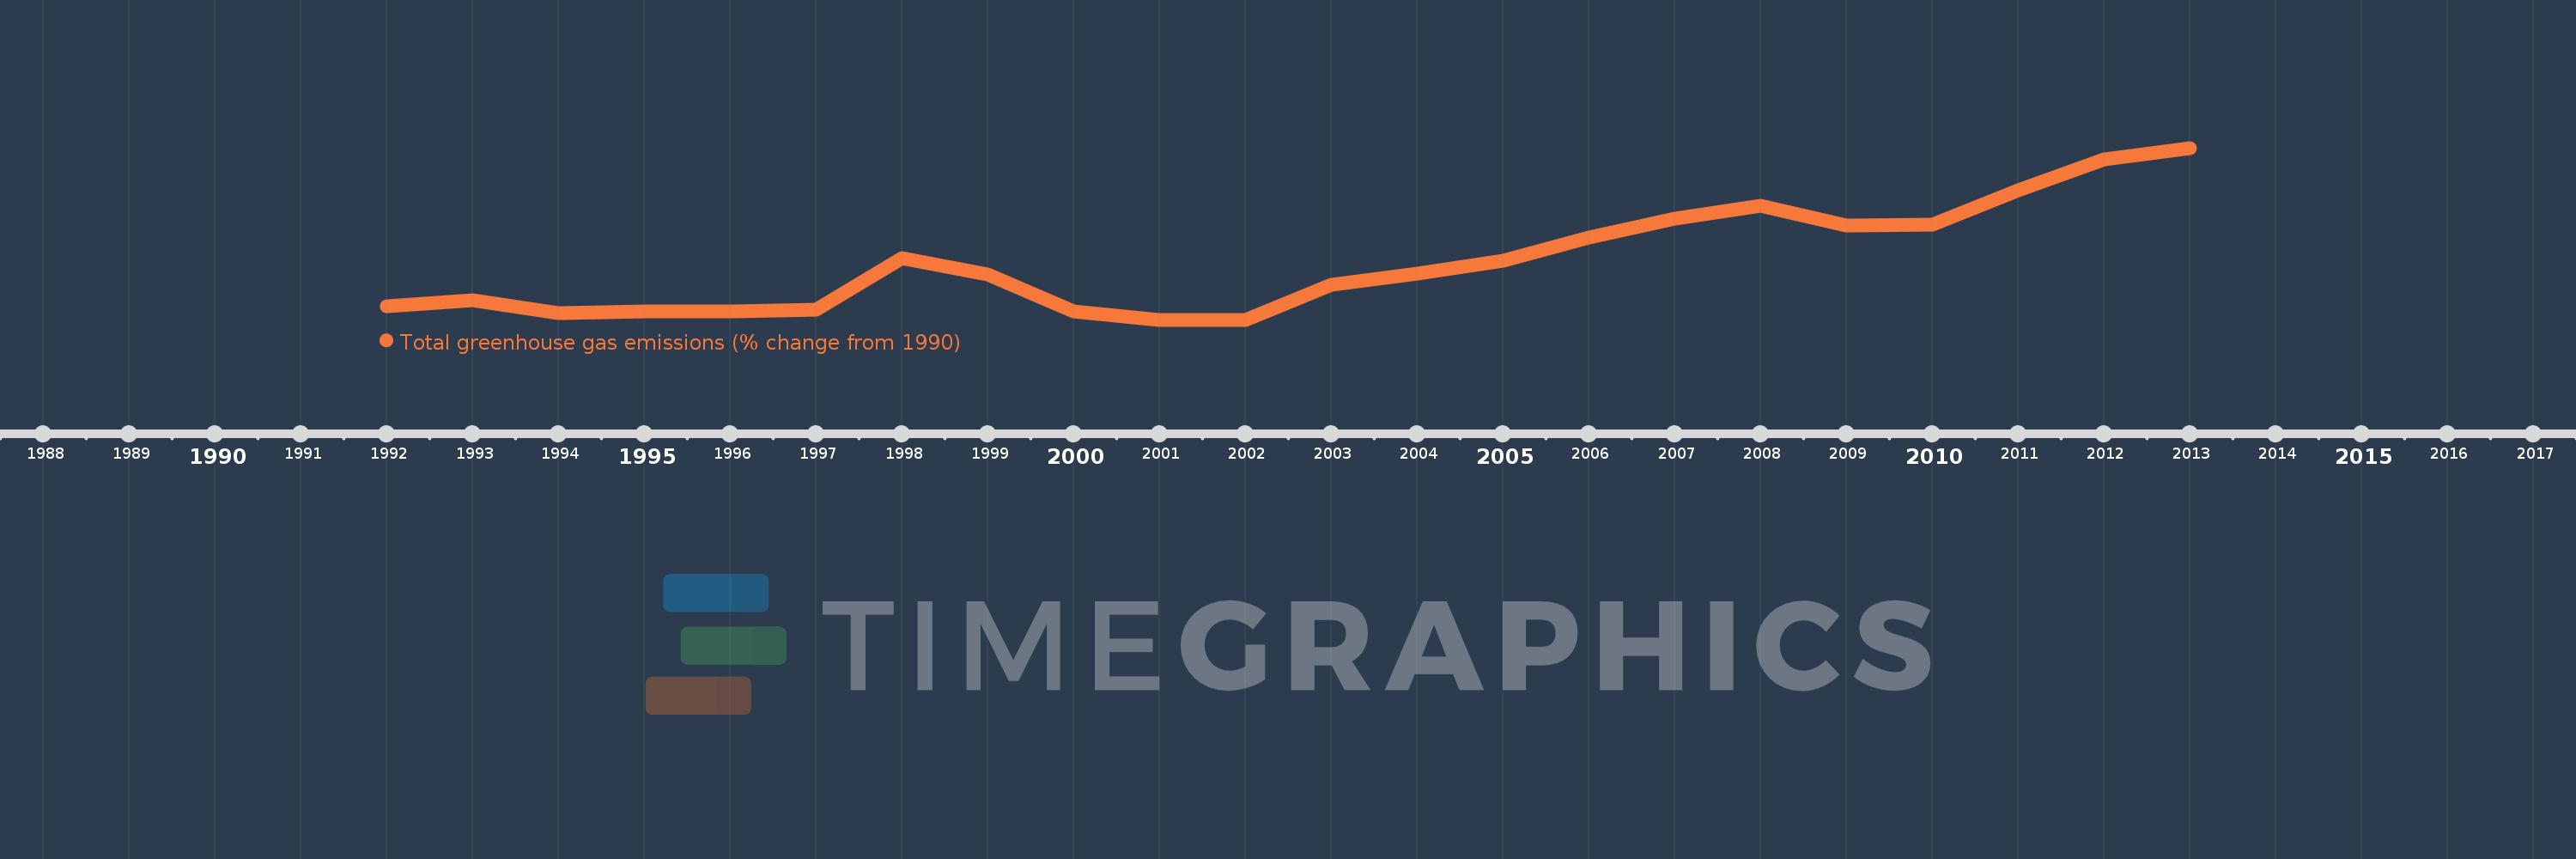
This timeline shows a graph from 1992 to 2013 of Middle income. No data until 1991. Number of actual observations by date: 22.
Source name:
World Development Indicators
Source organization:
World Bank staff estimates from original source: European Commission, Joint Research Centre (JRC)/Netherlands Environmental Assessment Agency (PBL). Emission Database for Global Atmospheric Research (EDGAR): http://edgar.jrc.ec.europa.eu/.
Categories, topics:
Climate Change, Environment
Last updated:
apr 23, 2017
Indicators value changes by year
Meaning:
18.915
Minimum:
-1.251
jan 1, 2002
Maximum:
58.886
jan 1, 2013
At the date of observation
Value
Absolute change
Change from the previous value
jan 1, 1992
3.412
+3.412
0.0%
jan 1, 1993
5.464
+2.052
60.15%
jan 1, 1994
0.96
-4.503
-82.42%
jan 1, 1995
1.587
+0.626
65.22%
jan 1, 1996
1.596
+0.01
0.61%
jan 1, 1997
2.308
+0.711
44.55%
jan 1, 1998
20.282
+17.975
778.9%
jan 1, 1999
14.533
-5.749
-28.35%
jan 1, 2000
1.525
-13.008
-89.5%
jan 1, 2001
-1.236
-2.762
-181.06%
jan 1, 2002
-1.251
-0.015
1.21%
jan 1, 2003
10.847
+12.098
-966.93%
jan 1, 2004
14.841
+3.993
36.81%
jan 1, 2005
19.369
+4.529
30.52%
jan 1, 2006
27.612
+8.243
42.56%
jan 1, 2007
34.051
+6.439
23.32%
jan 1, 2008
38.724
+4.673
13.72%
jan 1, 2009
31.657
-7.067
-18.25%
jan 1, 2010
32.037
+0.38
1.2%
jan 1, 2011
44.019
+11.982
37.4%
jan 1, 2012
54.903
+10.885
24.73%
jan 1, 2013
58.886
+3.983
7.25%
Ranking of countries by current statistics by years