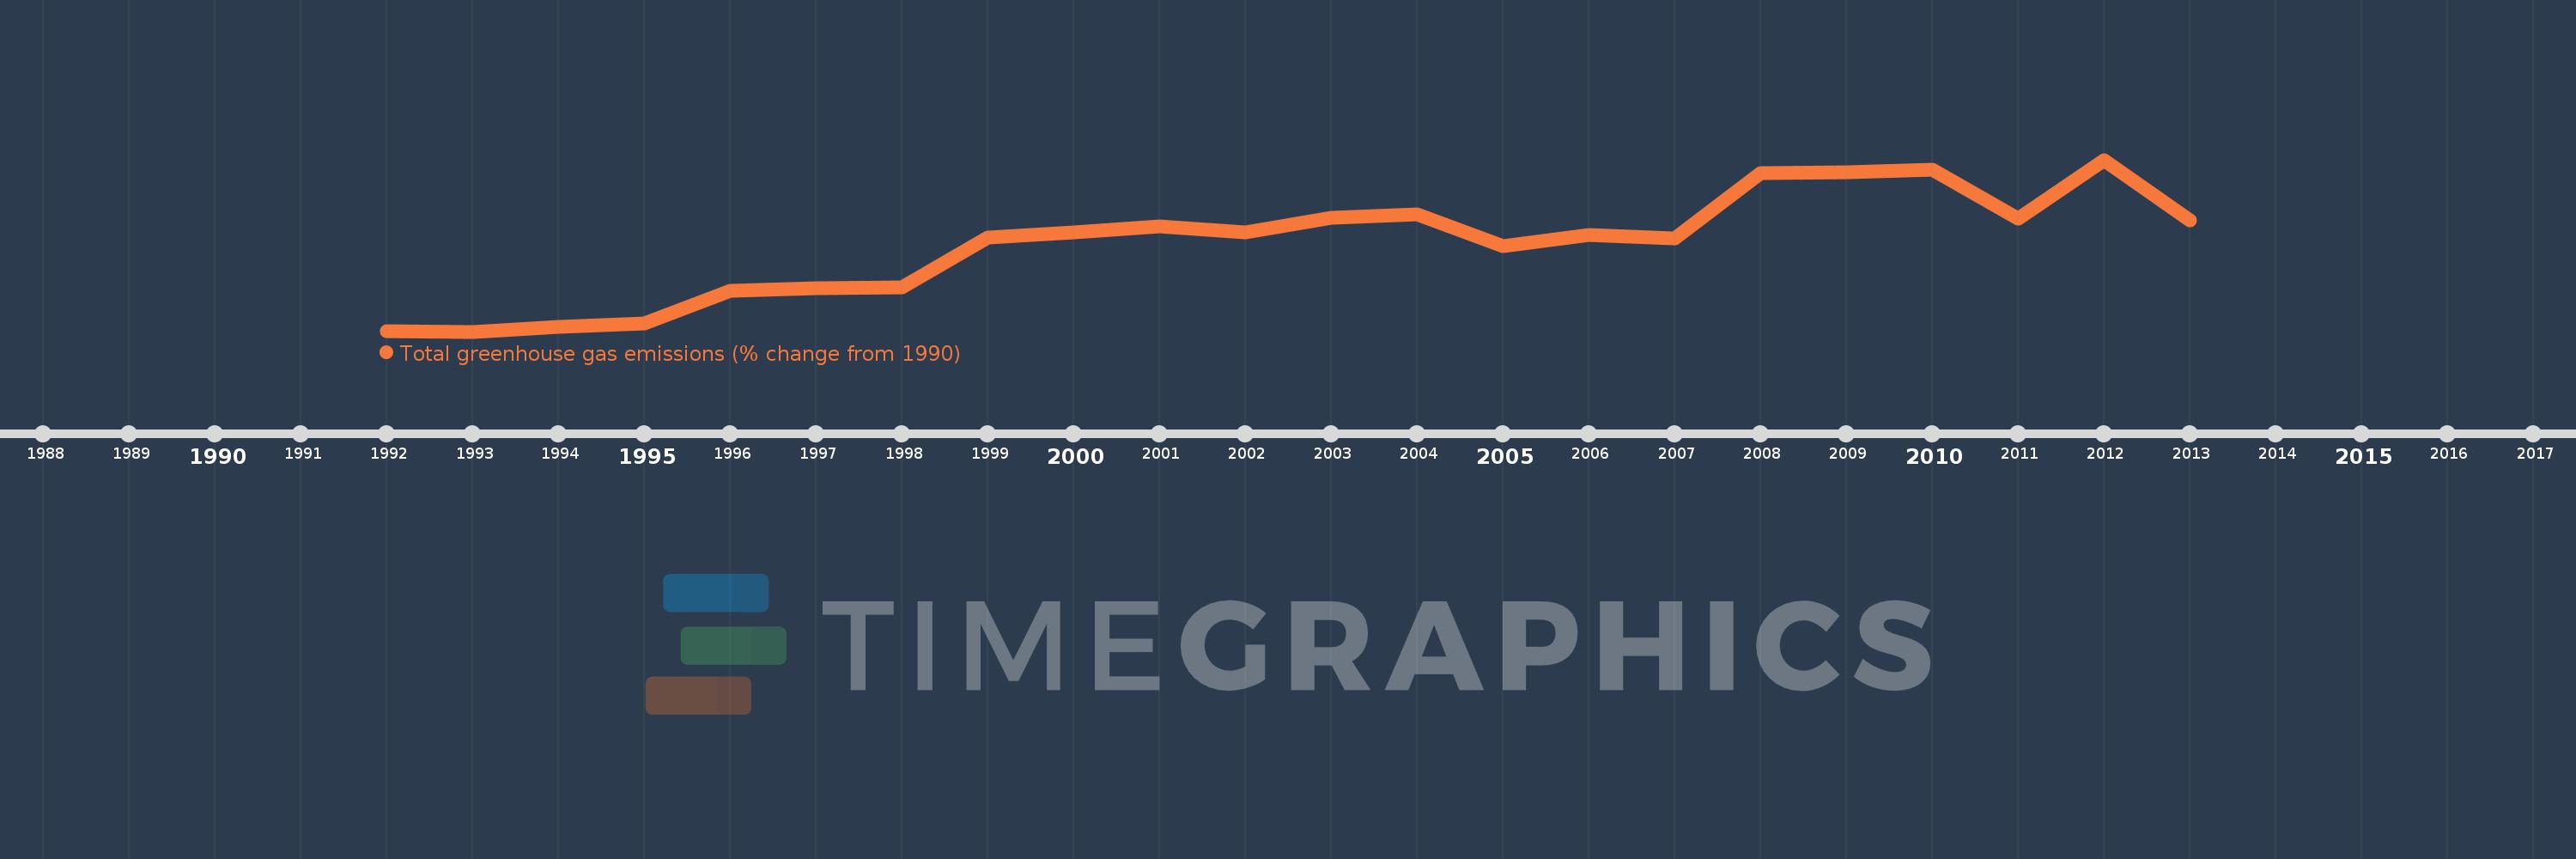
This timeline shows a graph from 1992 to 2013 of Arab World. No data until 1991. Number of actual observations by date: 22.
Source name:
World Development Indicators
Source organization:
World Bank staff estimates from original source: European Commission, Joint Research Centre (JRC)/Netherlands Environmental Assessment Agency (PBL). Emission Database for Global Atmospheric Research (EDGAR): http://edgar.jrc.ec.europa.eu/.
Categories, topics:
Climate Change, Environment
Last updated:
apr 23, 2017
Indicators value changes by year
Meaning:
108.632
Minimum:
4.809
jan 1, 1993
Maximum:
208.913
jan 1, 2012
At the date of observation
Value
Absolute change
Change from the previous value
jan 1, 1992
5.105
+5.105
0.0%
jan 1, 1993
4.809
-0.296
-5.81%
jan 1, 1994
10.531
+5.722
119.0%
jan 1, 1995
14.456
+3.925
37.27%
jan 1, 1996
52.909
+38.453
266.0%
jan 1, 1997
56.496
+3.587
6.78%
jan 1, 1998
57.816
+1.32
2.34%
jan 1, 1999
116.92
+59.104
102.23%
jan 1, 2000
122.776
+5.857
5.01%
jan 1, 2001
130.175
+7.399
6.03%
jan 1, 2002
122.295
-7.881
-6.05%
jan 1, 2003
139.774
+17.48
14.29%
jan 1, 2004
144.209
+4.434
3.17%
jan 1, 2005
106.567
-37.642
-26.1%
jan 1, 2006
119.913
+13.346
12.52%
jan 1, 2007
115.361
-4.552
-3.8%
jan 1, 2008
193.007
+77.646
67.31%
jan 1, 2009
194.078
+1.071
0.55%
jan 1, 2010
196.99
+2.912
1.5%
jan 1, 2011
139.364
-57.626
-29.25%
jan 1, 2012
208.913
+69.549
49.9%
jan 1, 2013
137.43
-71.483
-34.22%
Ranking of countries by current statistics by years