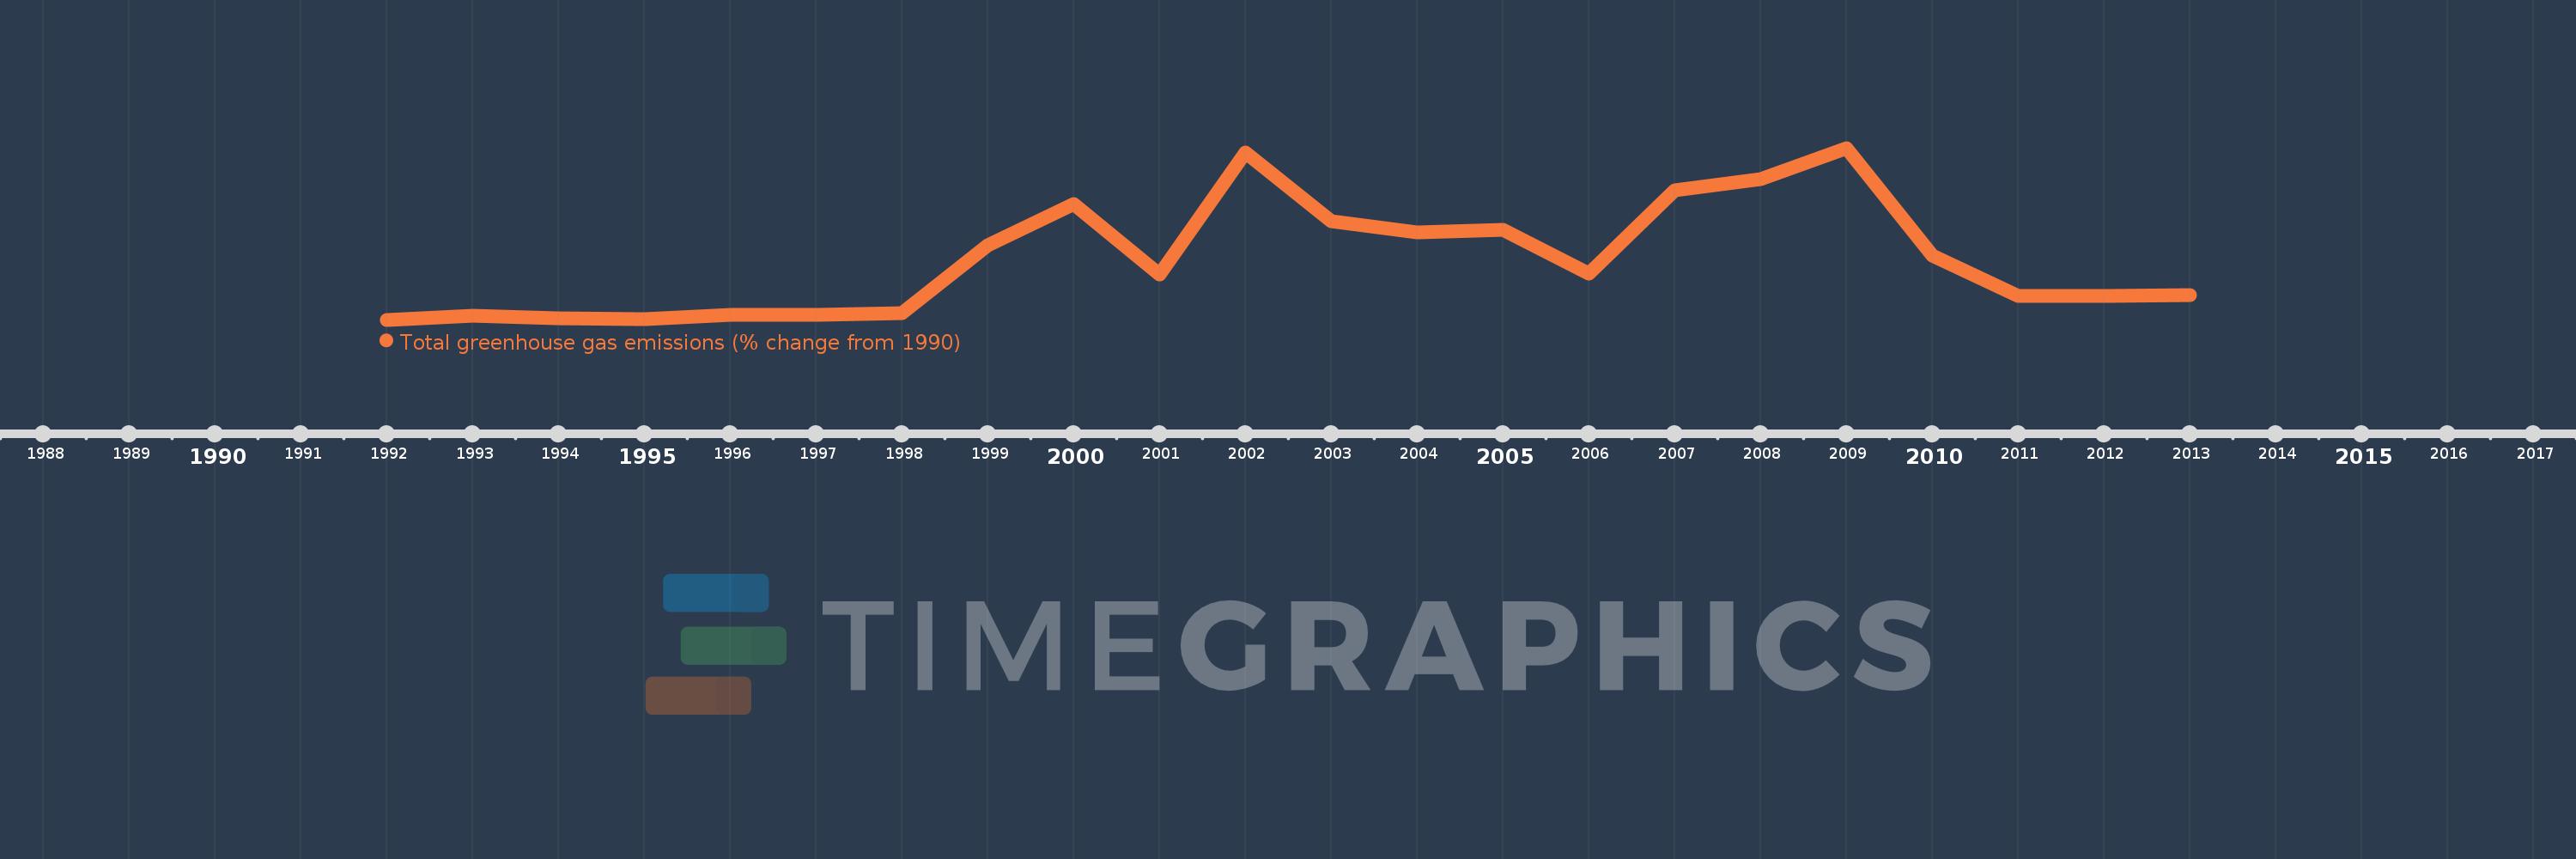
This timeline shows a graph from 1992 to 2013 of Sierra Leone. No data until 1991. Number of actual observations by date: 22.
Source name:
World Development Indicators
Source organization:
World Bank staff estimates from original source: European Commission, Joint Research Centre (JRC)/Netherlands Environmental Assessment Agency (PBL). Emission Database for Global Atmospheric Research (EDGAR): http://edgar.jrc.ec.europa.eu/.
Categories, topics:
Climate Change, Environment
Last updated:
apr 23, 2017
Indicators value changes by year
Meaning:
75.973
Minimum:
-14.233
jan 1, 1992
Maximum:
243.592
jan 1, 2009
At the date of observation
Value
Absolute change
Change from the previous value
jan 1, 1992
-14.233
-14.233
0.0%
jan 1, 1993
-8.617
+5.617
-39.46%
jan 1, 1994
-12.448
-3.831
44.46%
jan 1, 1995
-13.84
-1.392
11.19%
jan 1, 1996
-6.941
+6.899
-49.85%
jan 1, 1997
-7.351
-0.41
5.9%
jan 1, 1998
-4.804
+2.547
-34.65%
jan 1, 1999
97.134
+101.939
-2.12K%
jan 1, 2000
160.024
+62.89
64.75%
jan 1, 2001
53.331
-106.694
-66.67%
jan 1, 2002
236.425
+183.094
343.32%
jan 1, 2003
133.297
-103.128
-43.62%
jan 1, 2004
116.977
-16.32
-12.24%
jan 1, 2005
120.239
+3.263
2.79%
jan 1, 2006
54.425
-65.815
-54.74%
jan 1, 2007
180.235
+125.811
231.17%
jan 1, 2008
196.665
+16.43
9.12%
jan 1, 2009
243.592
+46.927
23.86%
jan 1, 2010
81.842
-161.751
-66.4%
jan 1, 2011
20.965
-60.876
-74.38%
jan 1, 2012
21.835
+0.869
4.14%
jan 1, 2013
22.662
+0.828
3.79%
Ranking of countries by current statistics by years