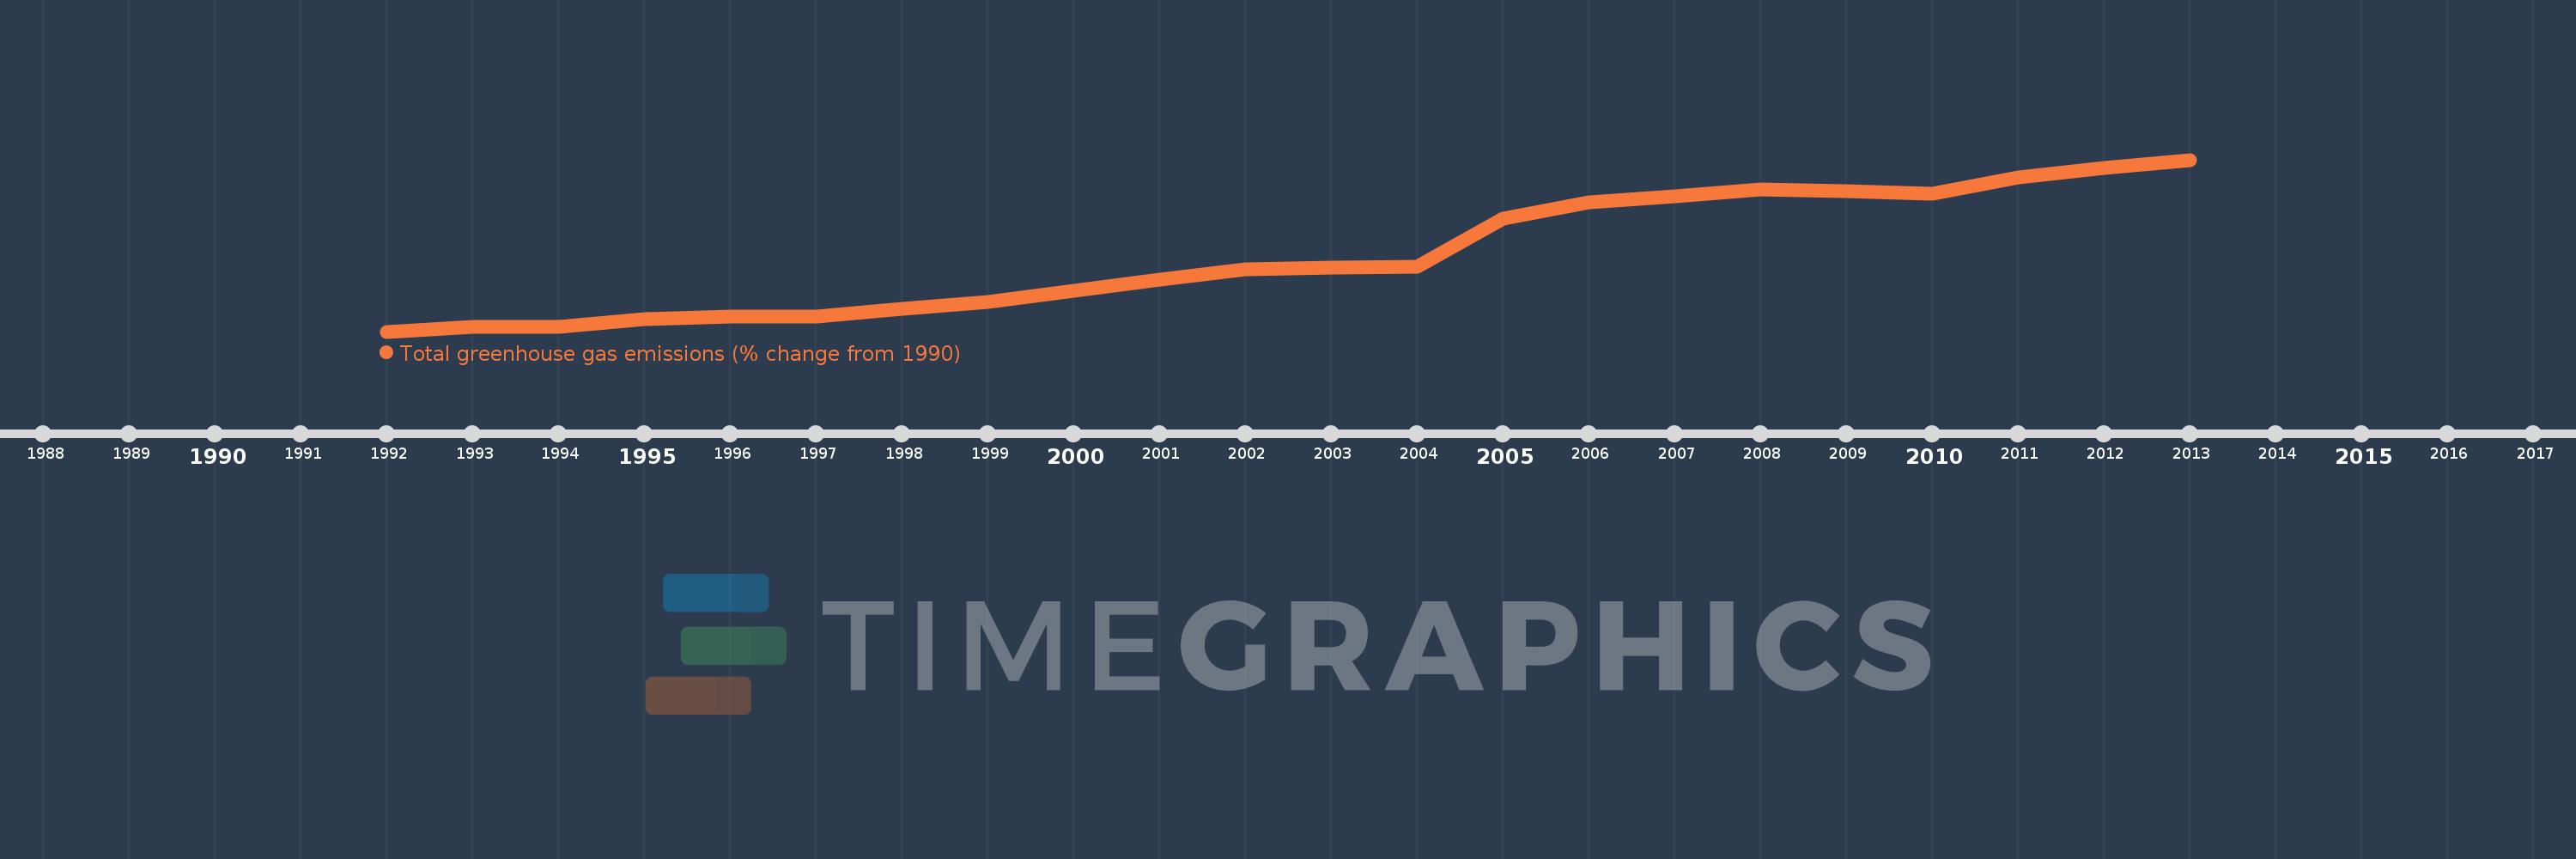
This timeline shows a graph from 1992 to 2013 of Morocco. No data until 1991. Number of actual observations by date: 22.
Source name:
World Development Indicators
Source organization:
World Bank staff estimates from original source: European Commission, Joint Research Centre (JRC)/Netherlands Environmental Assessment Agency (PBL). Emission Database for Global Atmospheric Research (EDGAR): http://edgar.jrc.ec.europa.eu/.
Categories, topics:
Climate Change, Environment
Last updated:
apr 23, 2017
Indicators value changes by year
Meaning:
51.742
Minimum:
1.998
jan 1, 1992
Maximum:
114.251
jan 1, 2013
At the date of observation
Value
Absolute change
Change from the previous value
jan 1, 1992
1.998
+1.998
0.0%
jan 1, 1993
5.265
+3.267
163.52%
jan 1, 1994
5.092
-0.173
-3.28%
jan 1, 1995
9.881
+4.788
94.03%
jan 1, 1996
11.611
+1.73
17.51%
jan 1, 1997
12.08
+0.47
4.05%
jan 1, 1998
17.043
+4.962
41.08%
jan 1, 1999
21.56
+4.517
26.51%
jan 1, 2000
28.509
+6.949
32.23%
jan 1, 2001
35.775
+7.266
25.49%
jan 1, 2002
42.652
+6.877
19.22%
jan 1, 2003
43.635
+0.983
2.3%
jan 1, 2004
44.555
+0.92
2.11%
jan 1, 2005
75.779
+31.224
70.08%
jan 1, 2006
86.51
+10.731
14.16%
jan 1, 2007
90.243
+3.733
4.31%
jan 1, 2008
94.744
+4.502
4.99%
jan 1, 2009
93.512
-1.232
-1.3%
jan 1, 2010
92.184
-1.328
-1.42%
jan 1, 2011
102.666
+10.482
11.37%
jan 1, 2012
108.776
+6.11
5.95%
jan 1, 2013
114.251
+5.475
5.03%
Ranking of countries by current statistics by years