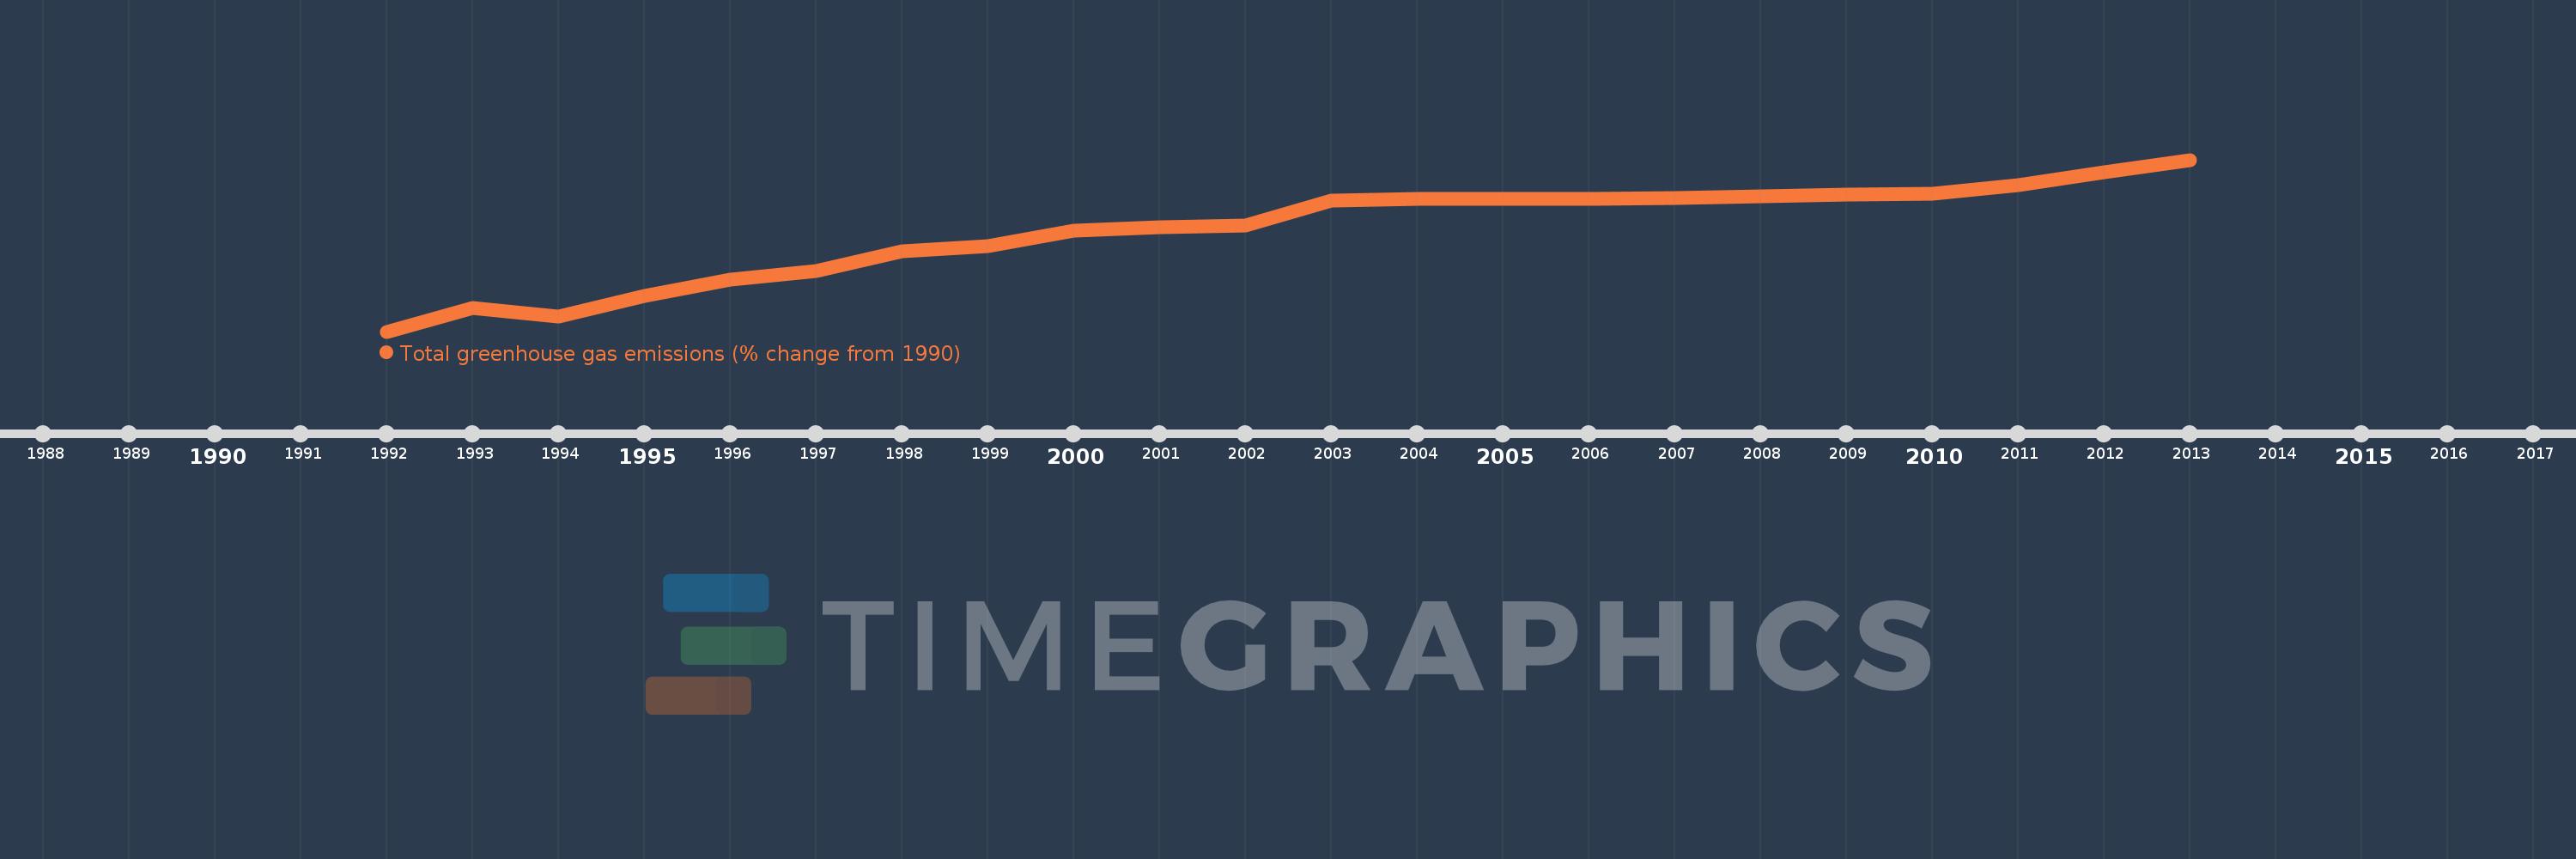
This timeline shows a graph from 1992 to 2013 of Tuvalu. No data until 1991. Number of actual observations by date: 22.
Source name:
World Development Indicators
Source organization:
World Bank staff estimates from original source: European Commission, Joint Research Centre (JRC)/Netherlands Environmental Assessment Agency (PBL). Emission Database for Global Atmospheric Research (EDGAR): http://edgar.jrc.ec.europa.eu/.
Categories, topics:
Climate Change, Environment
Last updated:
apr 23, 2017
Indicators value changes by year
Meaning:
21.006
Minimum:
8.362
jan 1, 1992
Maximum:
29.955
jan 1, 2013
At the date of observation
Value
Absolute change
Change from the previous value
jan 1, 1992
8.362
+8.362
0.0%
jan 1, 1993
11.318
+2.956
35.35%
jan 1, 1994
10.29
-1.028
-9.08%
jan 1, 1995
12.878
+2.587
25.14%
jan 1, 1996
14.851
+1.974
15.33%
jan 1, 1997
16.011
+1.16
7.81%
jan 1, 1998
18.428
+2.417
15.1%
jan 1, 1999
19.069
+0.641
3.48%
jan 1, 2000
21.081
+2.012
10.55%
jan 1, 2001
21.447
+0.366
1.74%
jan 1, 2002
21.707
+0.26
1.21%
jan 1, 2003
24.857
+3.15
14.51%
jan 1, 2004
25.027
+0.17
0.68%
jan 1, 2005
24.991
-0.036
-0.14%
jan 1, 2006
25.064
+0.073
0.29%
jan 1, 2007
25.123
+0.06
0.24%
jan 1, 2008
25.319
+0.196
0.78%
jan 1, 2009
25.557
+0.237
0.94%
jan 1, 2010
25.697
+0.14
0.55%
jan 1, 2011
26.725
+1.029
4.0%
jan 1, 2012
28.37
+1.644
6.15%
jan 1, 2013
29.955
+1.586
5.59%
Ranking of countries by current statistics by years