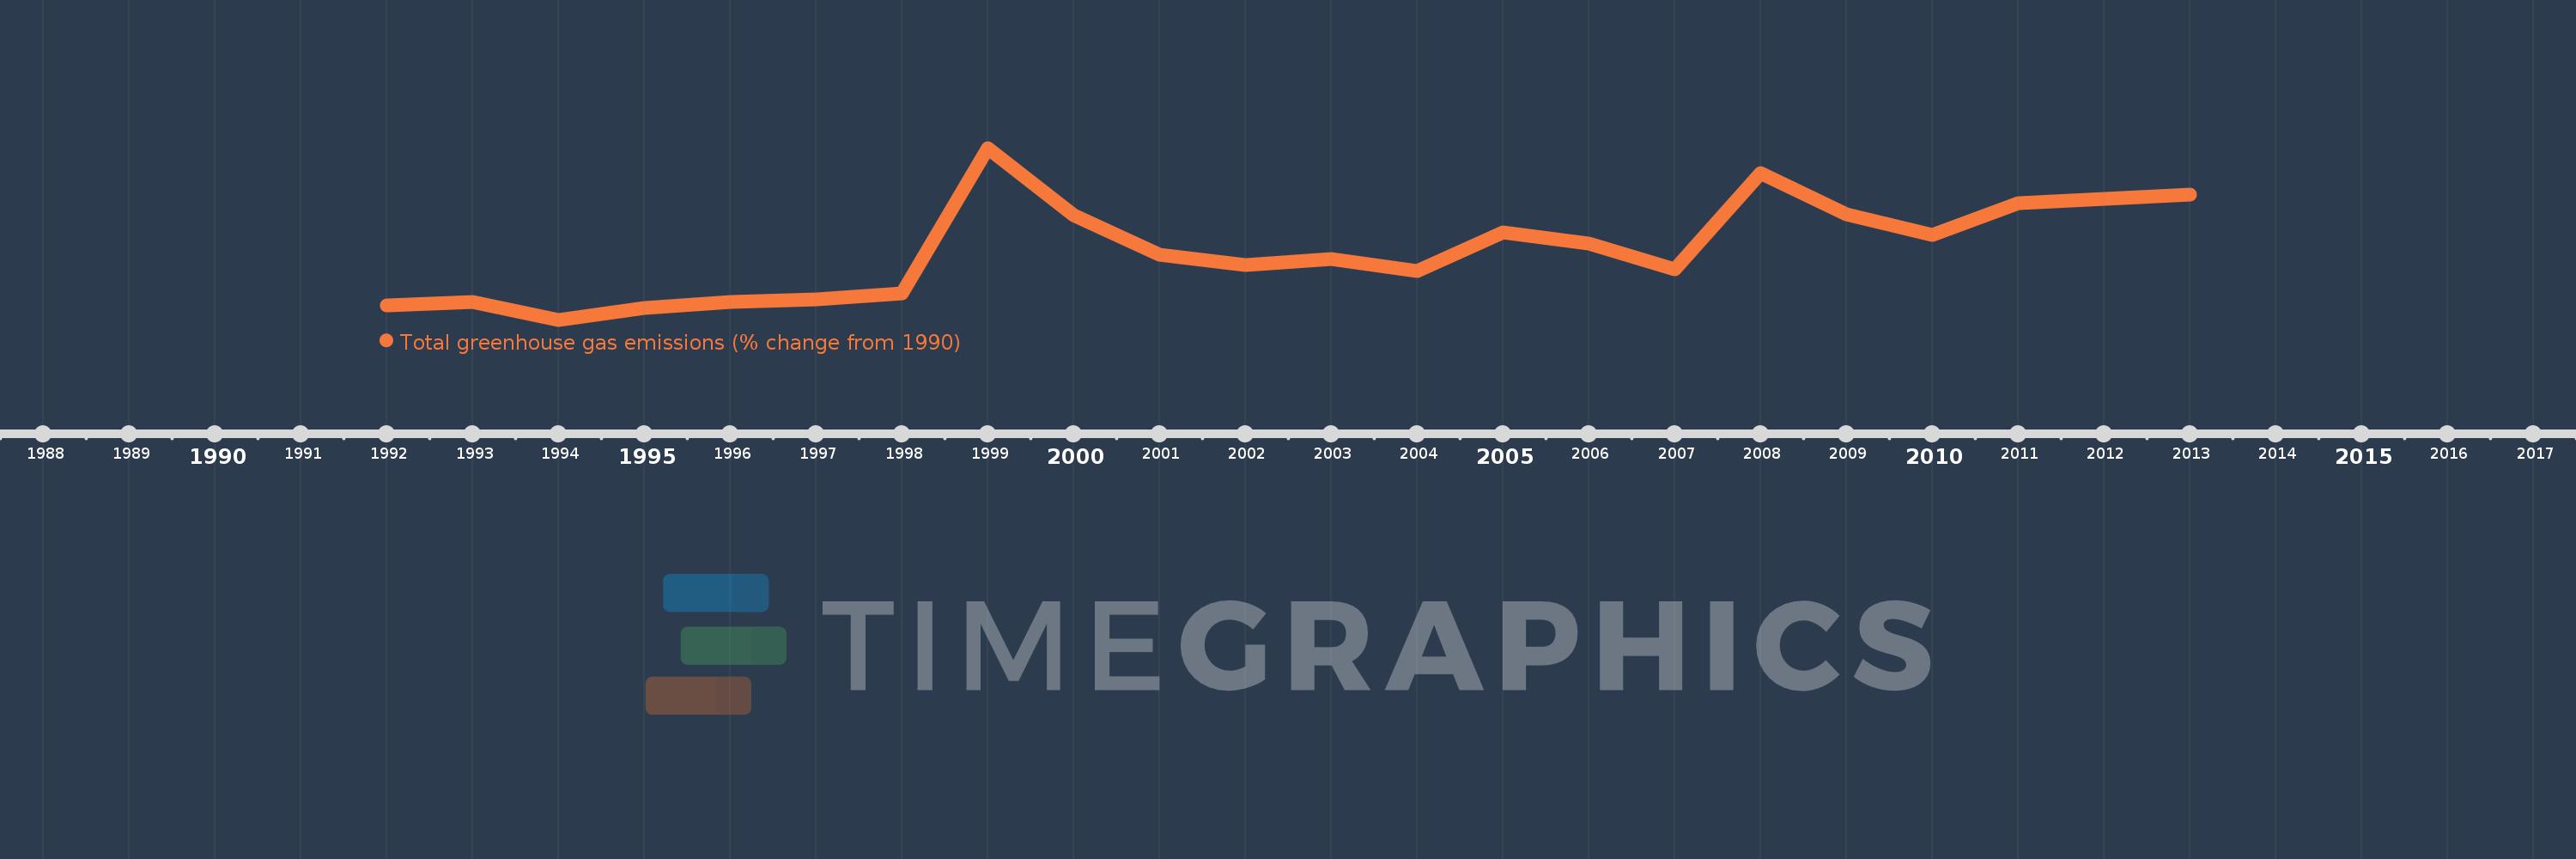
This timeline shows a graph from 1992 to 2013 of Swaziland. No data until 1991. Number of actual observations by date: 22.
Source name:
World Development Indicators
Source organization:
World Bank staff estimates from original source: European Commission, Joint Research Centre (JRC)/Netherlands Environmental Assessment Agency (PBL). Emission Database for Global Atmospheric Research (EDGAR): http://edgar.jrc.ec.europa.eu/.
Categories, topics:
Climate Change, Environment
Last updated:
apr 23, 2017
Indicators value changes by year
Meaning:
26.47
Minimum:
-7.475
jan 1, 1994
Maximum:
76.619
jan 1, 1999
At the date of observation
Value
Absolute change
Change from the previous value
jan 1, 1992
-0.525
-0.525
0.0%
jan 1, 1993
1.196
+1.72
-327.93%
jan 1, 1994
-7.475
-8.67
-725.16%
jan 1, 1995
-1.903
+5.571
-74.54%
jan 1, 1996
1.367
+3.271
-171.84%
jan 1, 1997
2.324
+0.957
69.98%
jan 1, 1998
5.466
+3.142
135.19%
jan 1, 1999
76.619
+71.153
1.3K%
jan 1, 2000
43.784
-32.835
-42.85%
jan 1, 2001
24.456
-19.328
-44.14%
jan 1, 2002
19.162
-5.295
-21.65%
jan 1, 2003
22.06
+2.899
15.13%
jan 1, 2004
16.393
-5.668
-25.69%
jan 1, 2005
35.24
+18.848
114.98%
jan 1, 2006
30.013
-5.227
-14.83%
jan 1, 2007
17.028
-12.985
-43.27%
jan 1, 2008
64.274
+47.246
277.46%
jan 1, 2009
43.96
-20.314
-31.61%
jan 1, 2010
34.085
-9.876
-22.46%
jan 1, 2011
49.376
+15.292
44.86%
jan 1, 2012
51.662
+2.285
4.63%
jan 1, 2013
53.785
+2.123
4.11%
Ranking of countries by current statistics by years